Copyright
©The Author(s) 2018.
World J Hepatol. Jul 27, 2018; 10(7): 462-473
Published online Jul 27, 2018. doi: 10.4254/wjh.v10.i7.462
Published online Jul 27, 2018. doi: 10.4254/wjh.v10.i7.462
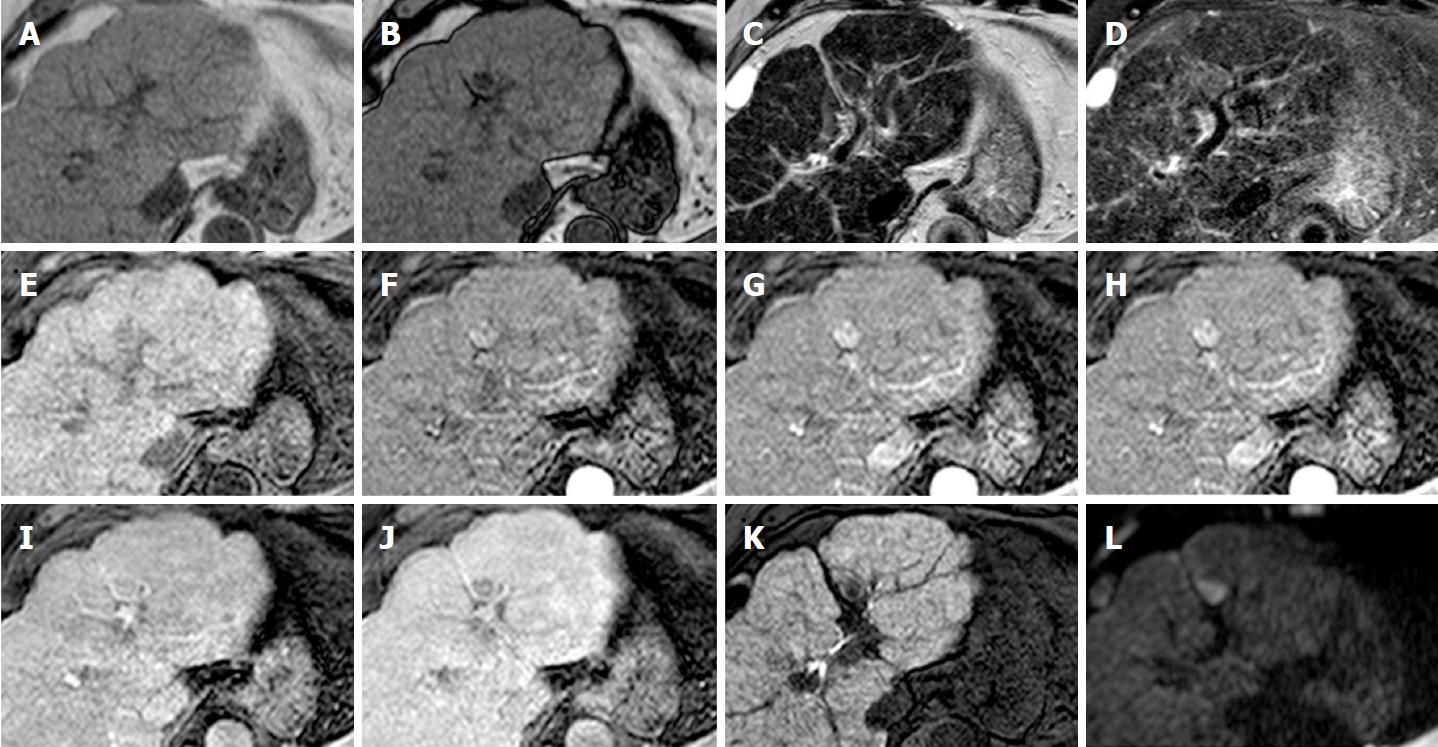
Figure 4 Typical case of lipid-rich hepatocellular carcinoma.
A and B: The signal loss of nodule on opposed-phase compared to in-phase indicates intralesional fat; C and D: There is mild signal intensity on T2 and DWI restriction (L); E: The nodule appears hypointense in pre-contrast phase; G-J: Note the typical arterial phase hyperenhancement (G and H) followed by washout appearance in the portal venous (I) and/or delayed phase (J) that is the key diagnostic feature of HCC; K: The lesion also demonstrate hypointensity in the hepatobiliary phase; F-H: Note how the multi-arterial phase imaging (F and H) able improve the conspicuity of the HCC, especially in the late arterial phase (H). DWI: Diffusion weighted images; HCC: Hepatocellular carcinoma.
- Citation: Inchingolo R, Faletti R, Grazioli L, Tricarico E, Gatti M, Pecorelli A, Ippolito D. MR with Gd-EOB-DTPA in assessment of liver nodules in cirrhotic patients. World J Hepatol 2018; 10(7): 462-473
- URL: https://www.wjgnet.com/1948-5182/full/v10/i7/462.htm
- DOI: https://dx.doi.org/10.4254/wjh.v10.i7.462


