Copyright
©The Author(s) 2018.
World J Hepatol. Feb 27, 2018; 10(2): 287-296
Published online Feb 27, 2018. doi: 10.4254/wjh.v10.i2.287
Published online Feb 27, 2018. doi: 10.4254/wjh.v10.i2.287
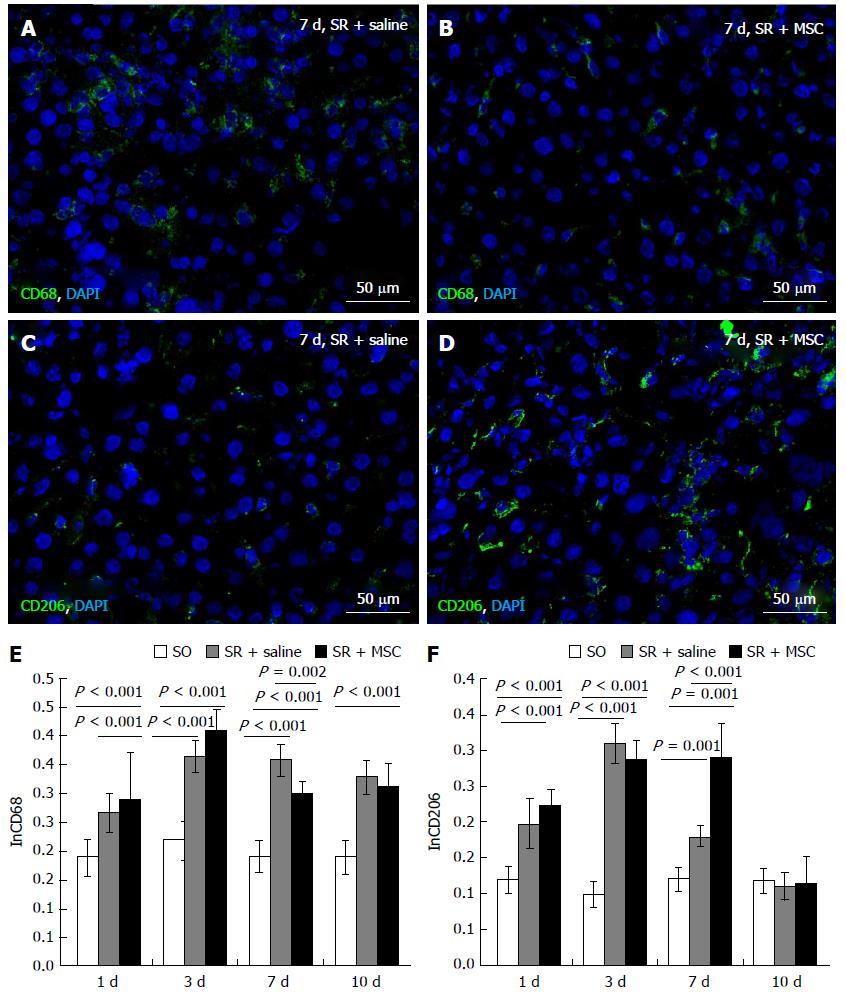
Figure 3 Influence of the transplantation on macrophage polarization profiles.
CD68+ cells (green) in the liver in the comparison group (A) and in the residual liver in the MSC transplantation group (B) on day 7 after the surgery. The diagram shows dynamic changes in the CD68+ cell content liver in the comparison group and in the multipotent stromal cells (MSC) transplantation group (E); Relative quantities of CD206+ cells (green) in the liver in the comparison group (C) and in the residual liver in the MSC transplantation group (D) on day 7 after the surgery; The diagram shows dynamic changes in the CD206+ cell content in the course of regeneration; cell nuclei are counterstained with 4′,6-Diamidino-2-phenylindole (blue). In E and F, white columns represent the sham-operated animals, gray columns represent the comparison group, black columns represent the MSC transplantation group, horizontal axis represents time elapsed after the surgery. SR: Subtotal resection; SO: Sham-operated animals; MSC: Multipotent stromal cells.
- Citation: Elchaninov A, Fatkhudinov T, Usman N, Arutyunyan I, Makarov A, Lokhonina A, Eremina I, Surovtsev V, Goldshtein D, Bolshakova G, Glinkina V, Sukhikh G. Multipotent stromal cells stimulate liver regeneration by influencing the macrophage polarization in rat. World J Hepatol 2018; 10(2): 287-296
- URL: https://www.wjgnet.com/1948-5182/full/v10/i2/287.htm
- DOI: https://dx.doi.org/10.4254/wjh.v10.i2.287


