Copyright
©The Author(s) 2018.
World J Hepatol. Dec 27, 2018; 10(12): 924-933
Published online Dec 27, 2018. doi: 10.4254/wjh.v10.i12.924
Published online Dec 27, 2018. doi: 10.4254/wjh.v10.i12.924
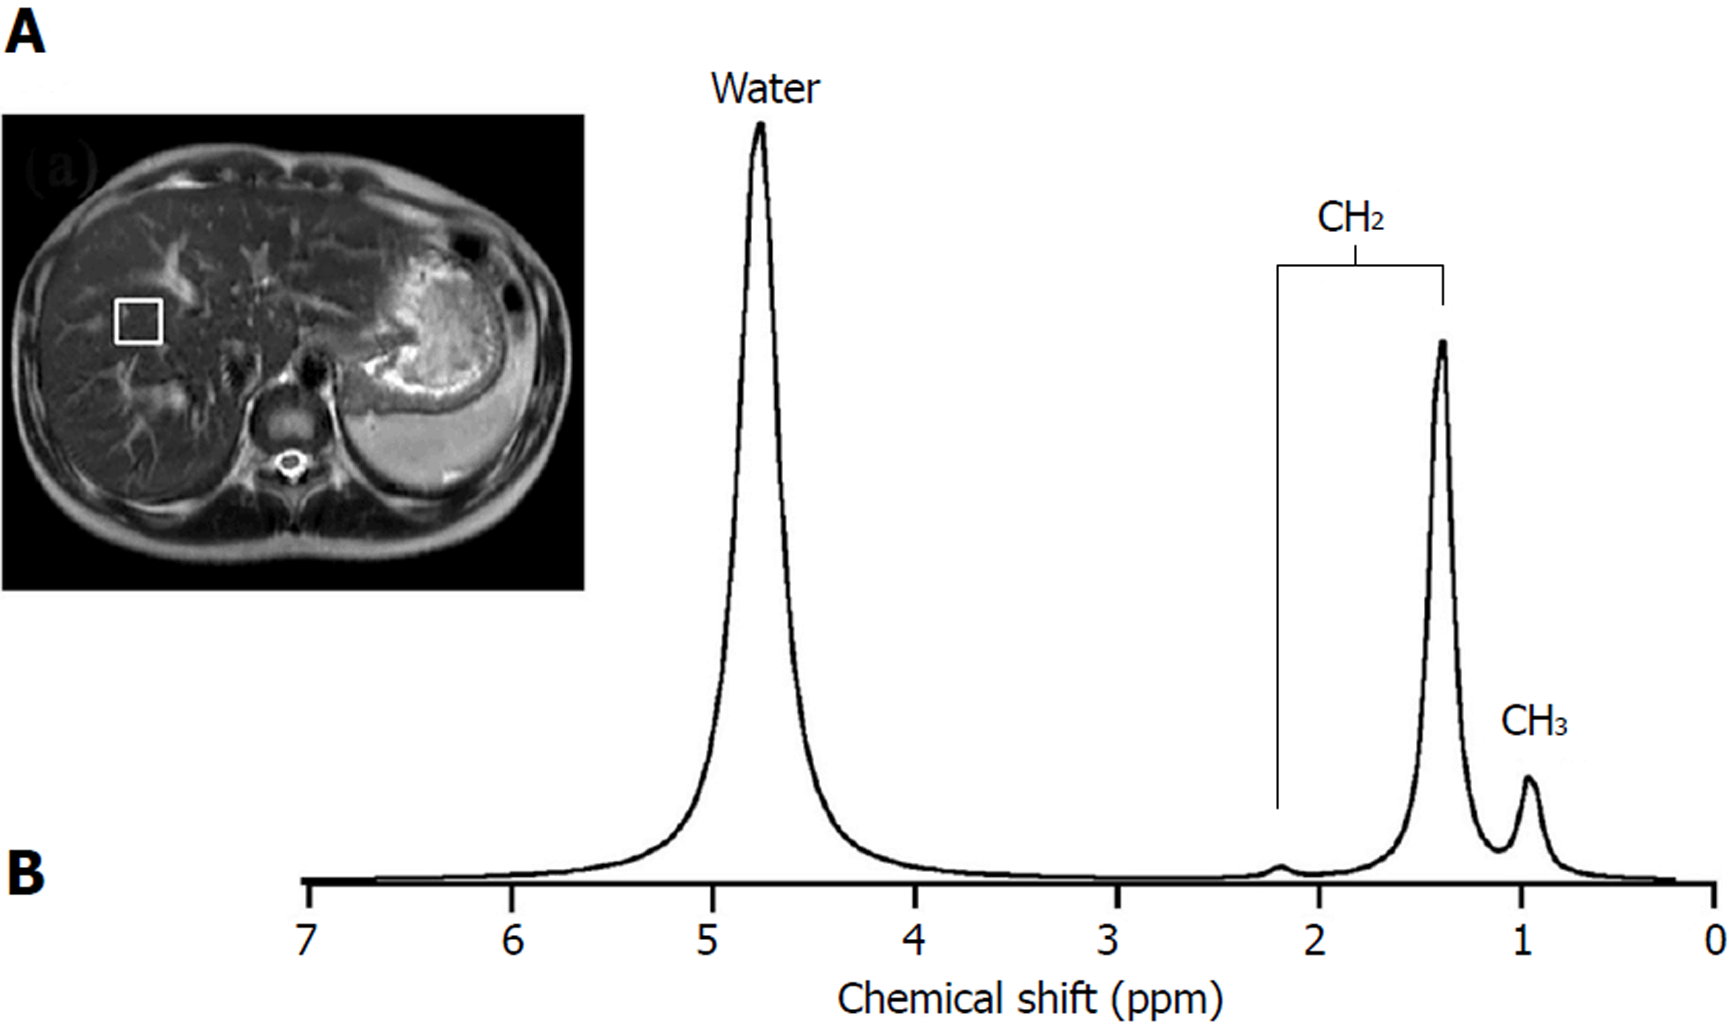
Figure 1 Proton magnetic resonance spectroscopy technique was used for liver fat assessment.
Water peak was shown occurring at 4.72 ppm, peaks in fat for CH3 occurred at 0.9 ppm, and CH2 peaked at 1.3 ppm and 2.1 ppm. A: Magnetic resonance imaging axial image of abdomen show voxel localization in right lobe liver for liver fat content quantification. B: Representative fitted proton magnetic resonance spectroscopy spectrum of right lobe liver.
- Citation: Pasanta D, Tungjai M, Chancharunee S, Sajomsang W, Kothan S. Body mass index and its effects on liver fat content in overweight and obese young adults by proton magnetic resonance spectroscopy technique. World J Hepatol 2018; 10(12): 924-933
- URL: https://www.wjgnet.com/1948-5182/full/v10/i12/924.htm
- DOI: https://dx.doi.org/10.4254/wjh.v10.i12.924


