Copyright
©The Author(s) 2024.
World J Hepatol. Apr 27, 2024; 16(4): 625-639
Published online Apr 27, 2024. doi: 10.4254/wjh.v16.i4.625
Published online Apr 27, 2024. doi: 10.4254/wjh.v16.i4.625
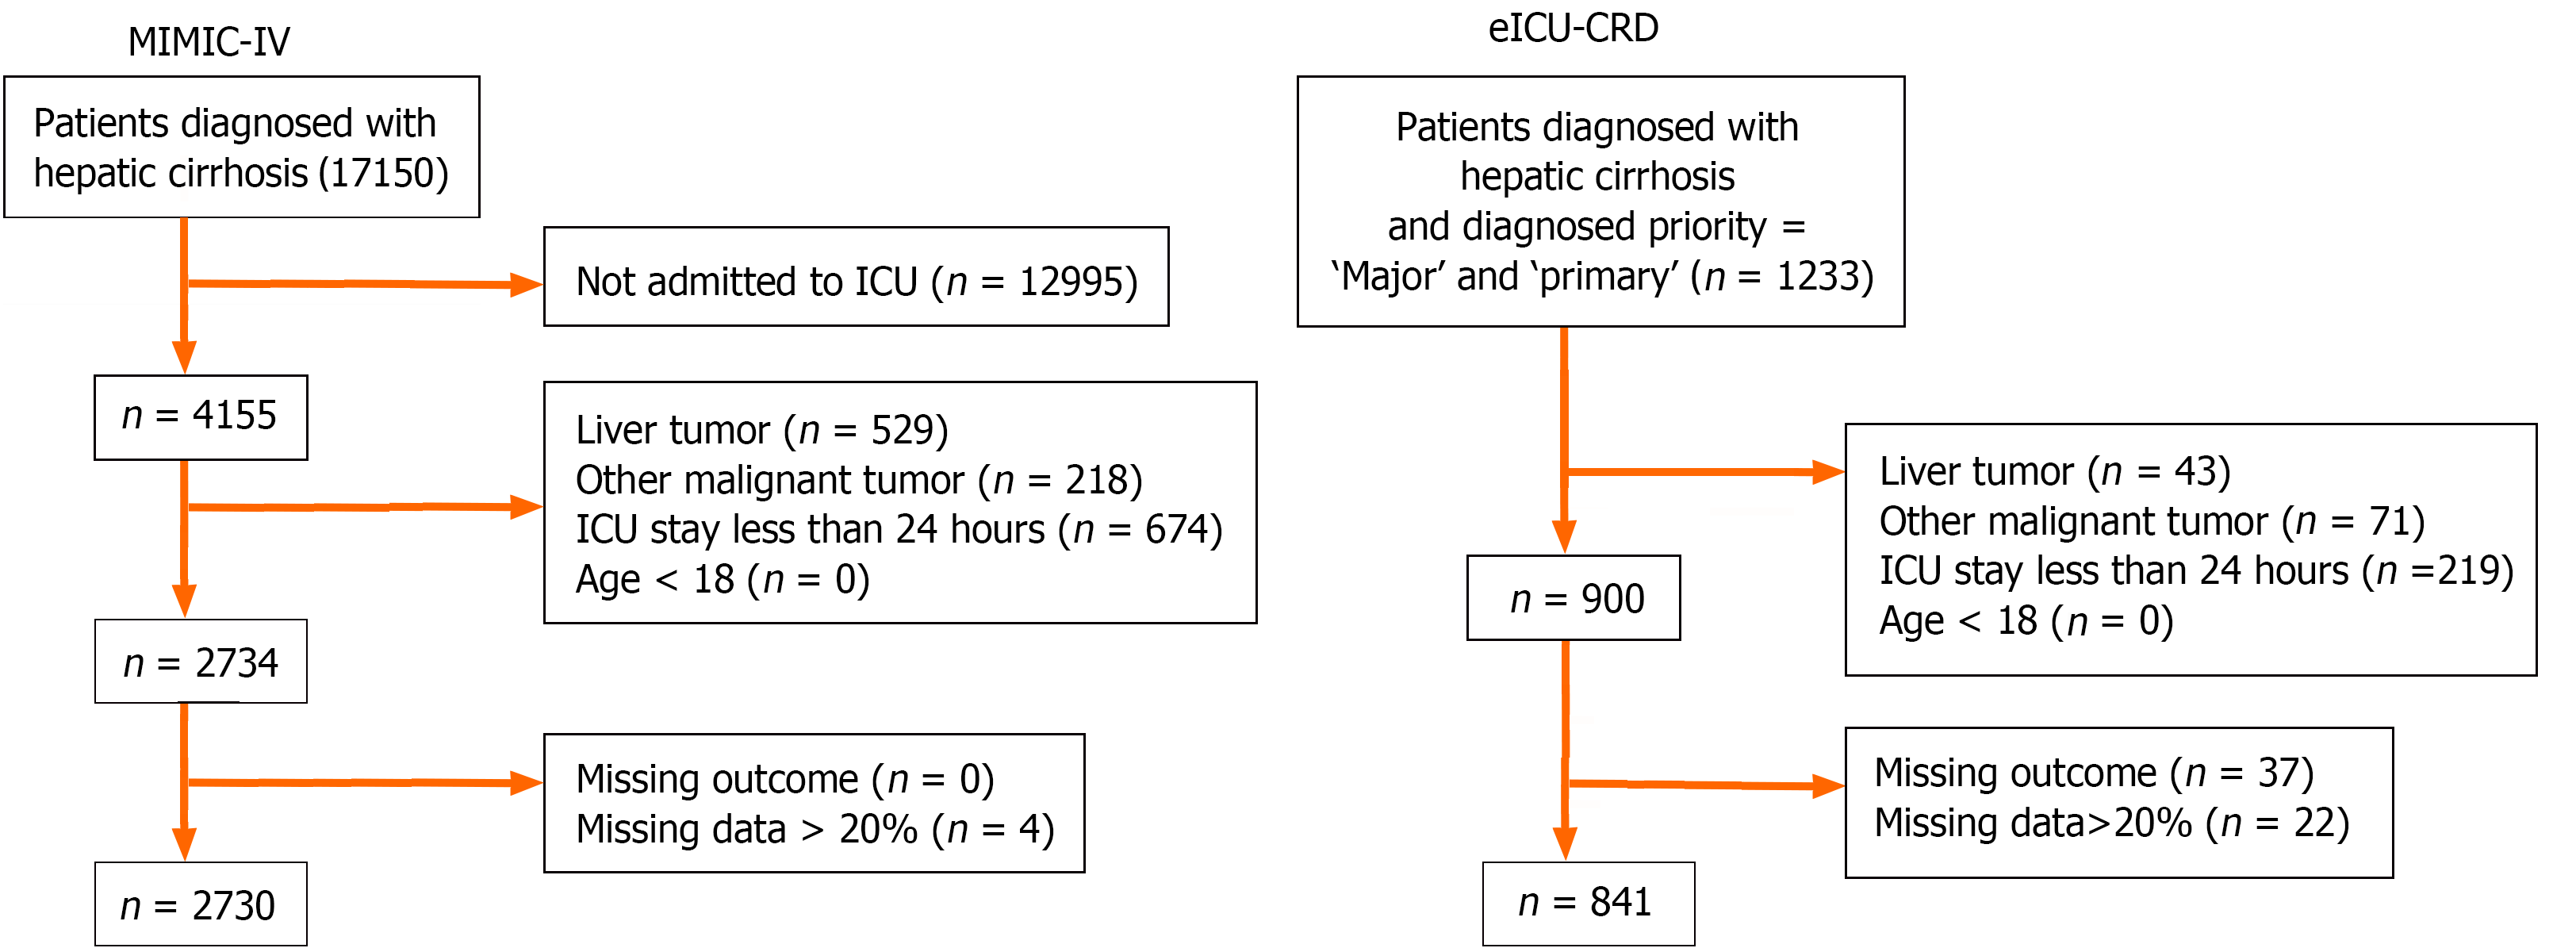
Figure 1 Flowchart of the data extraction procedure.
MIMIC-IV: Medical Information Mart for Intensive Care IV; ICU: intensive care unit; eICU-CRD: Electronic intensive care unit collaborative research database.
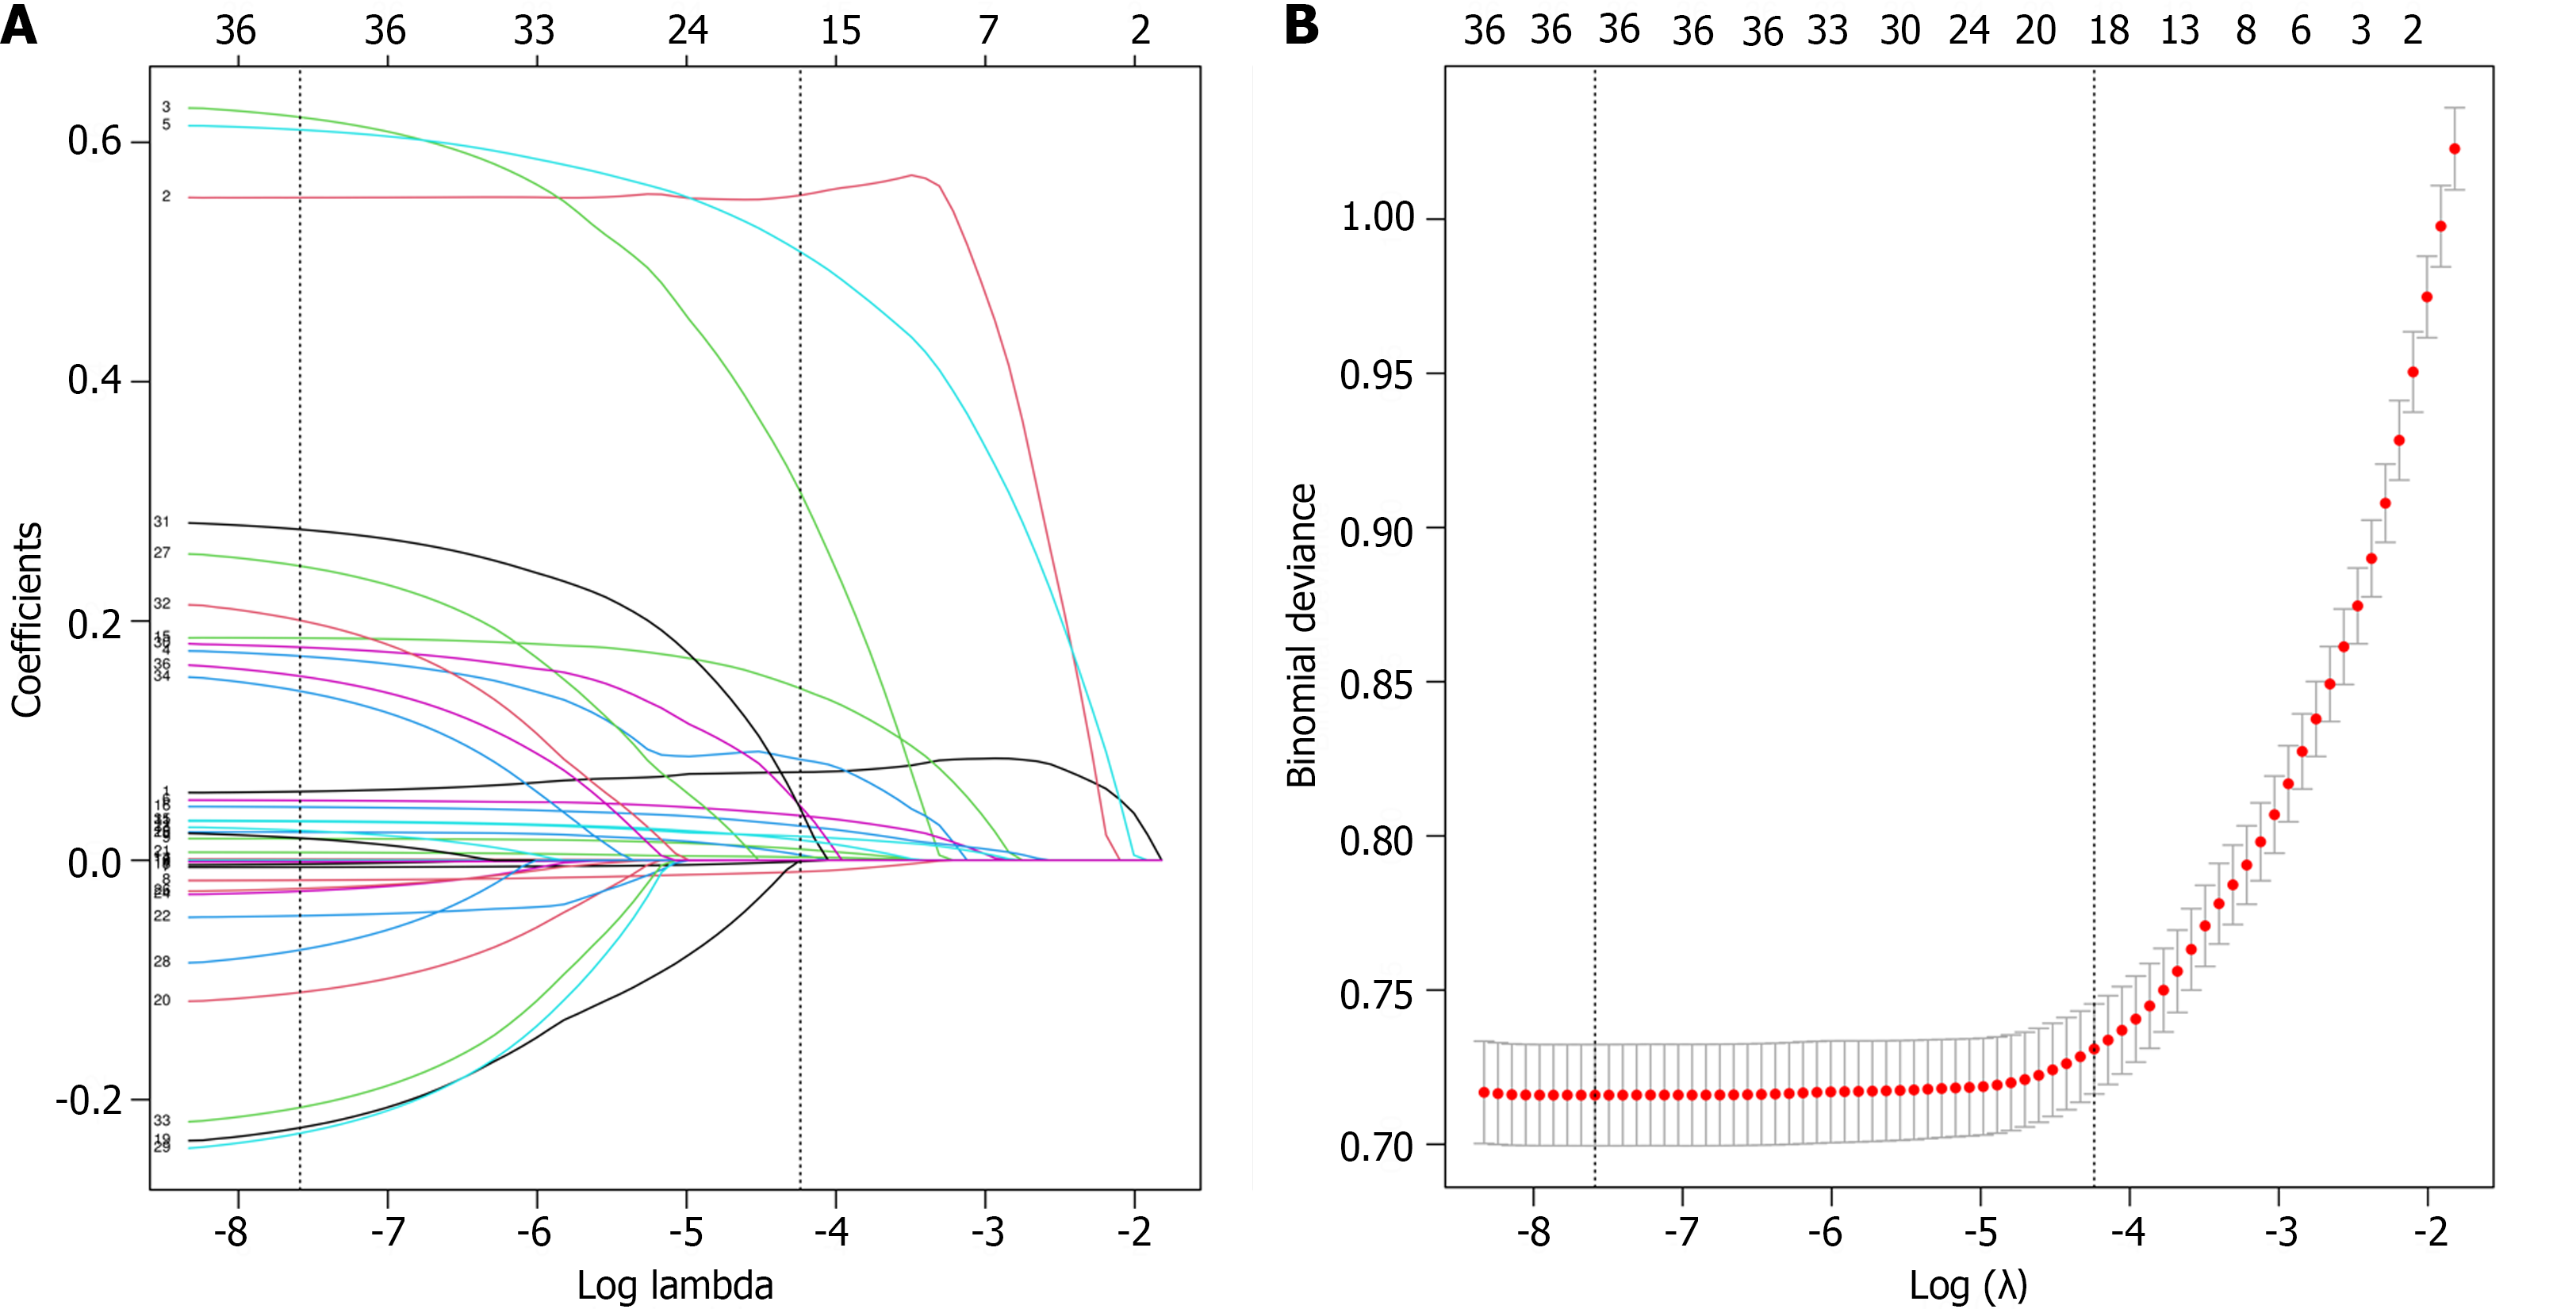
Figure 2 Clinical feature selection based on least absolute shrinkage and selection operator logistic regression.
A: Selection of the optimal lambda according to least absolute shrinkage and selection operator (LASSO) logistic regression. Each line represents the change in the coefficient of each feature; B: LASSO coefficient profiles of features. The left and right black vertical lines were drawn at the lambda with minim deviance and 1 standard error to the lambda with minim deviance.
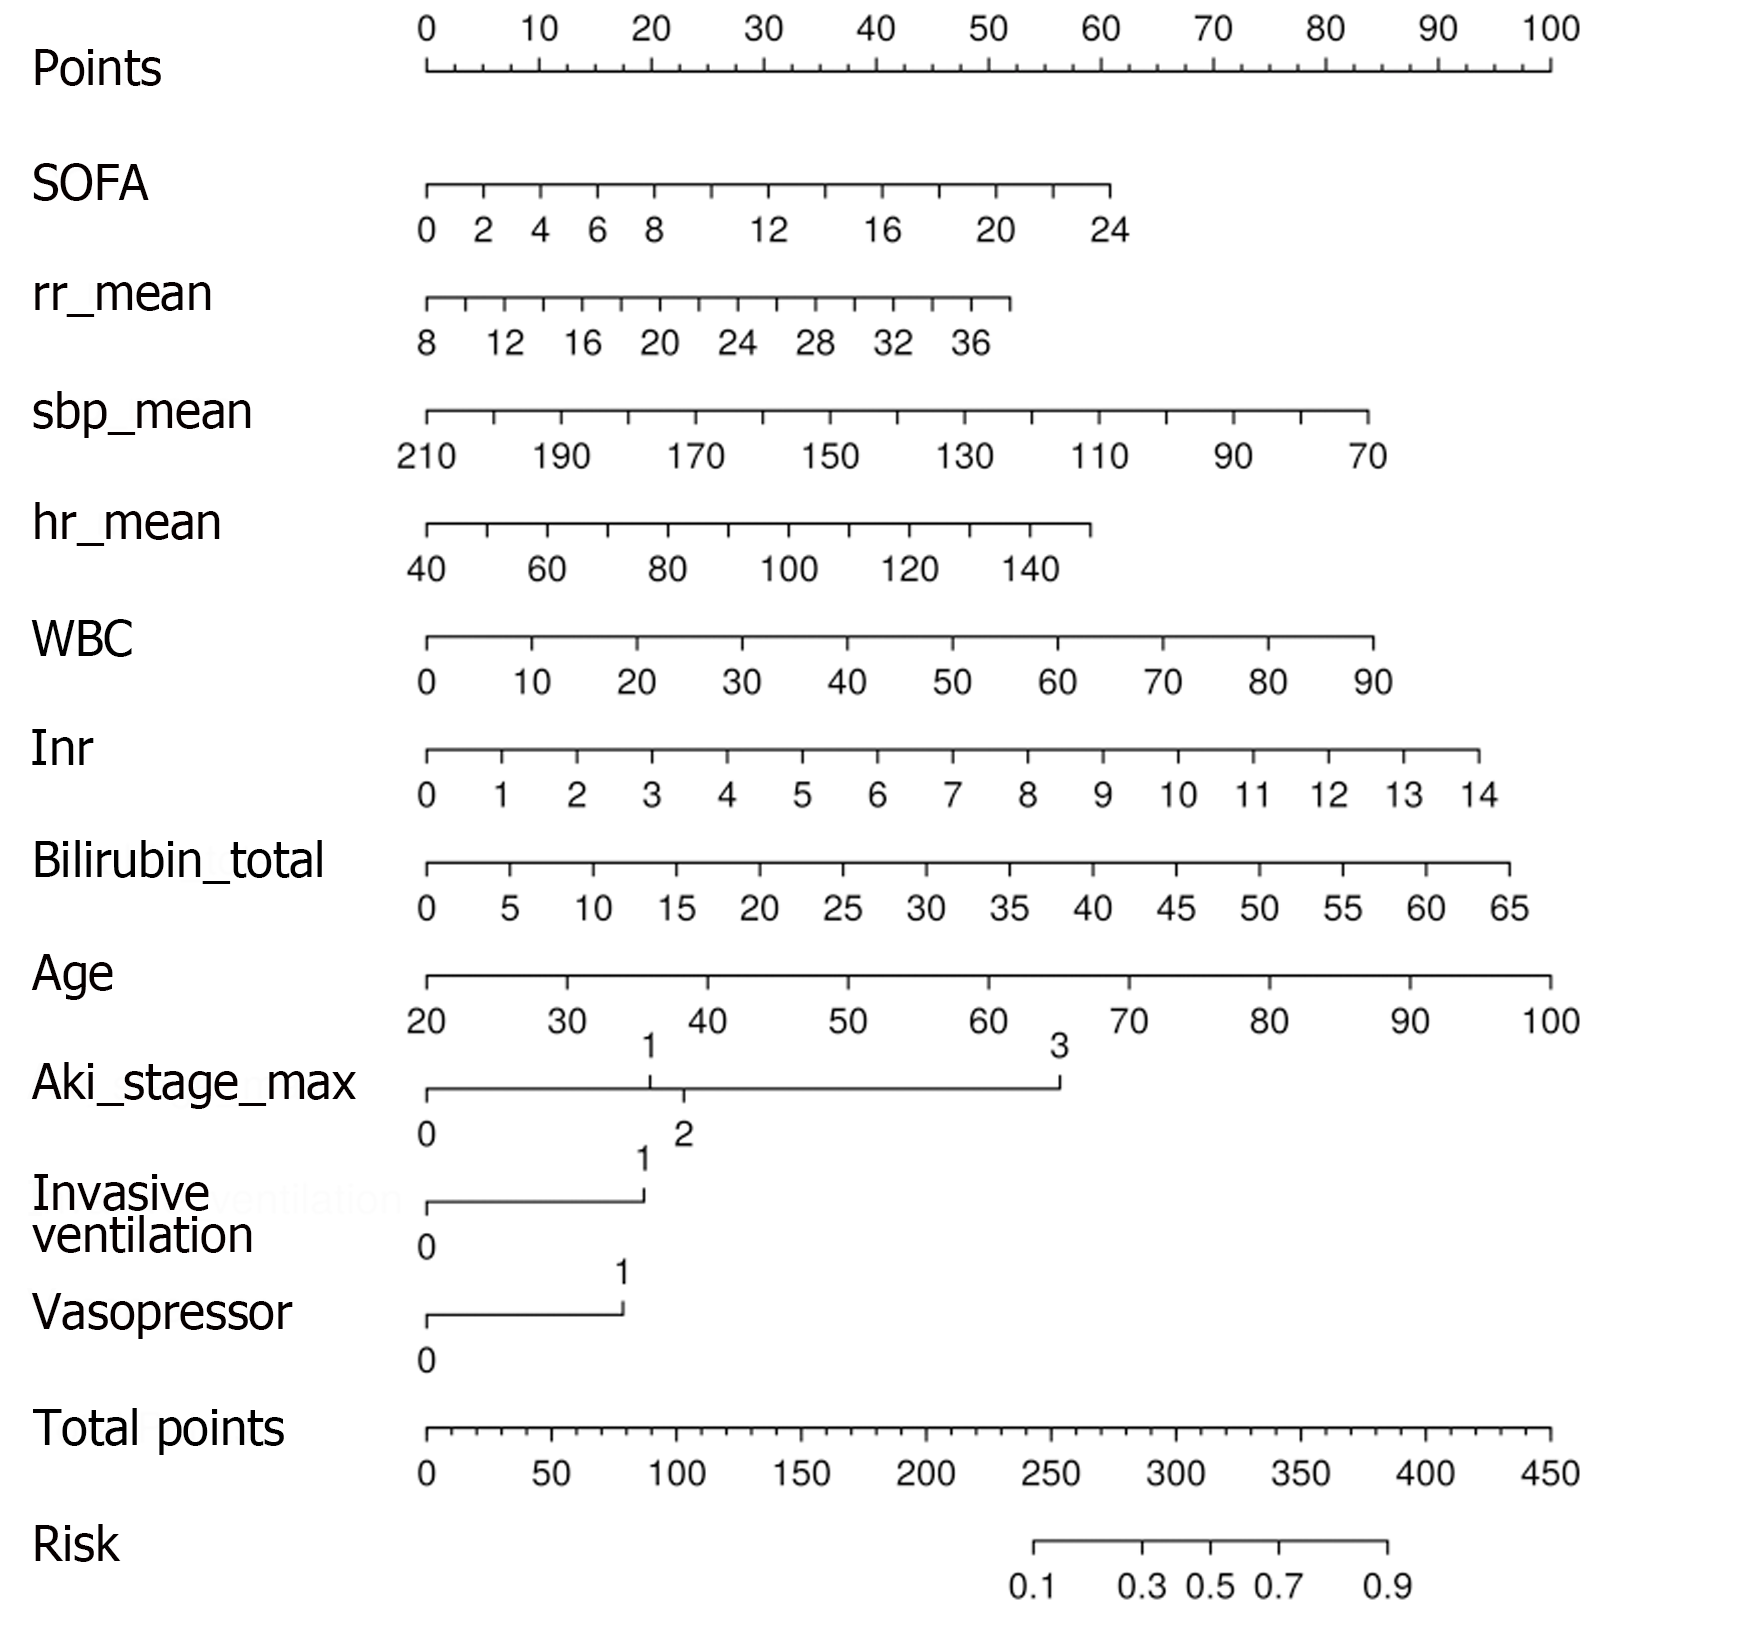
Figure 3 Nomogram based on the logistic regression model.
The score of each predictor was summed to obtain the total points. The total points were used to determine the risk of death. SOFA: Sequential organ failure assessment.
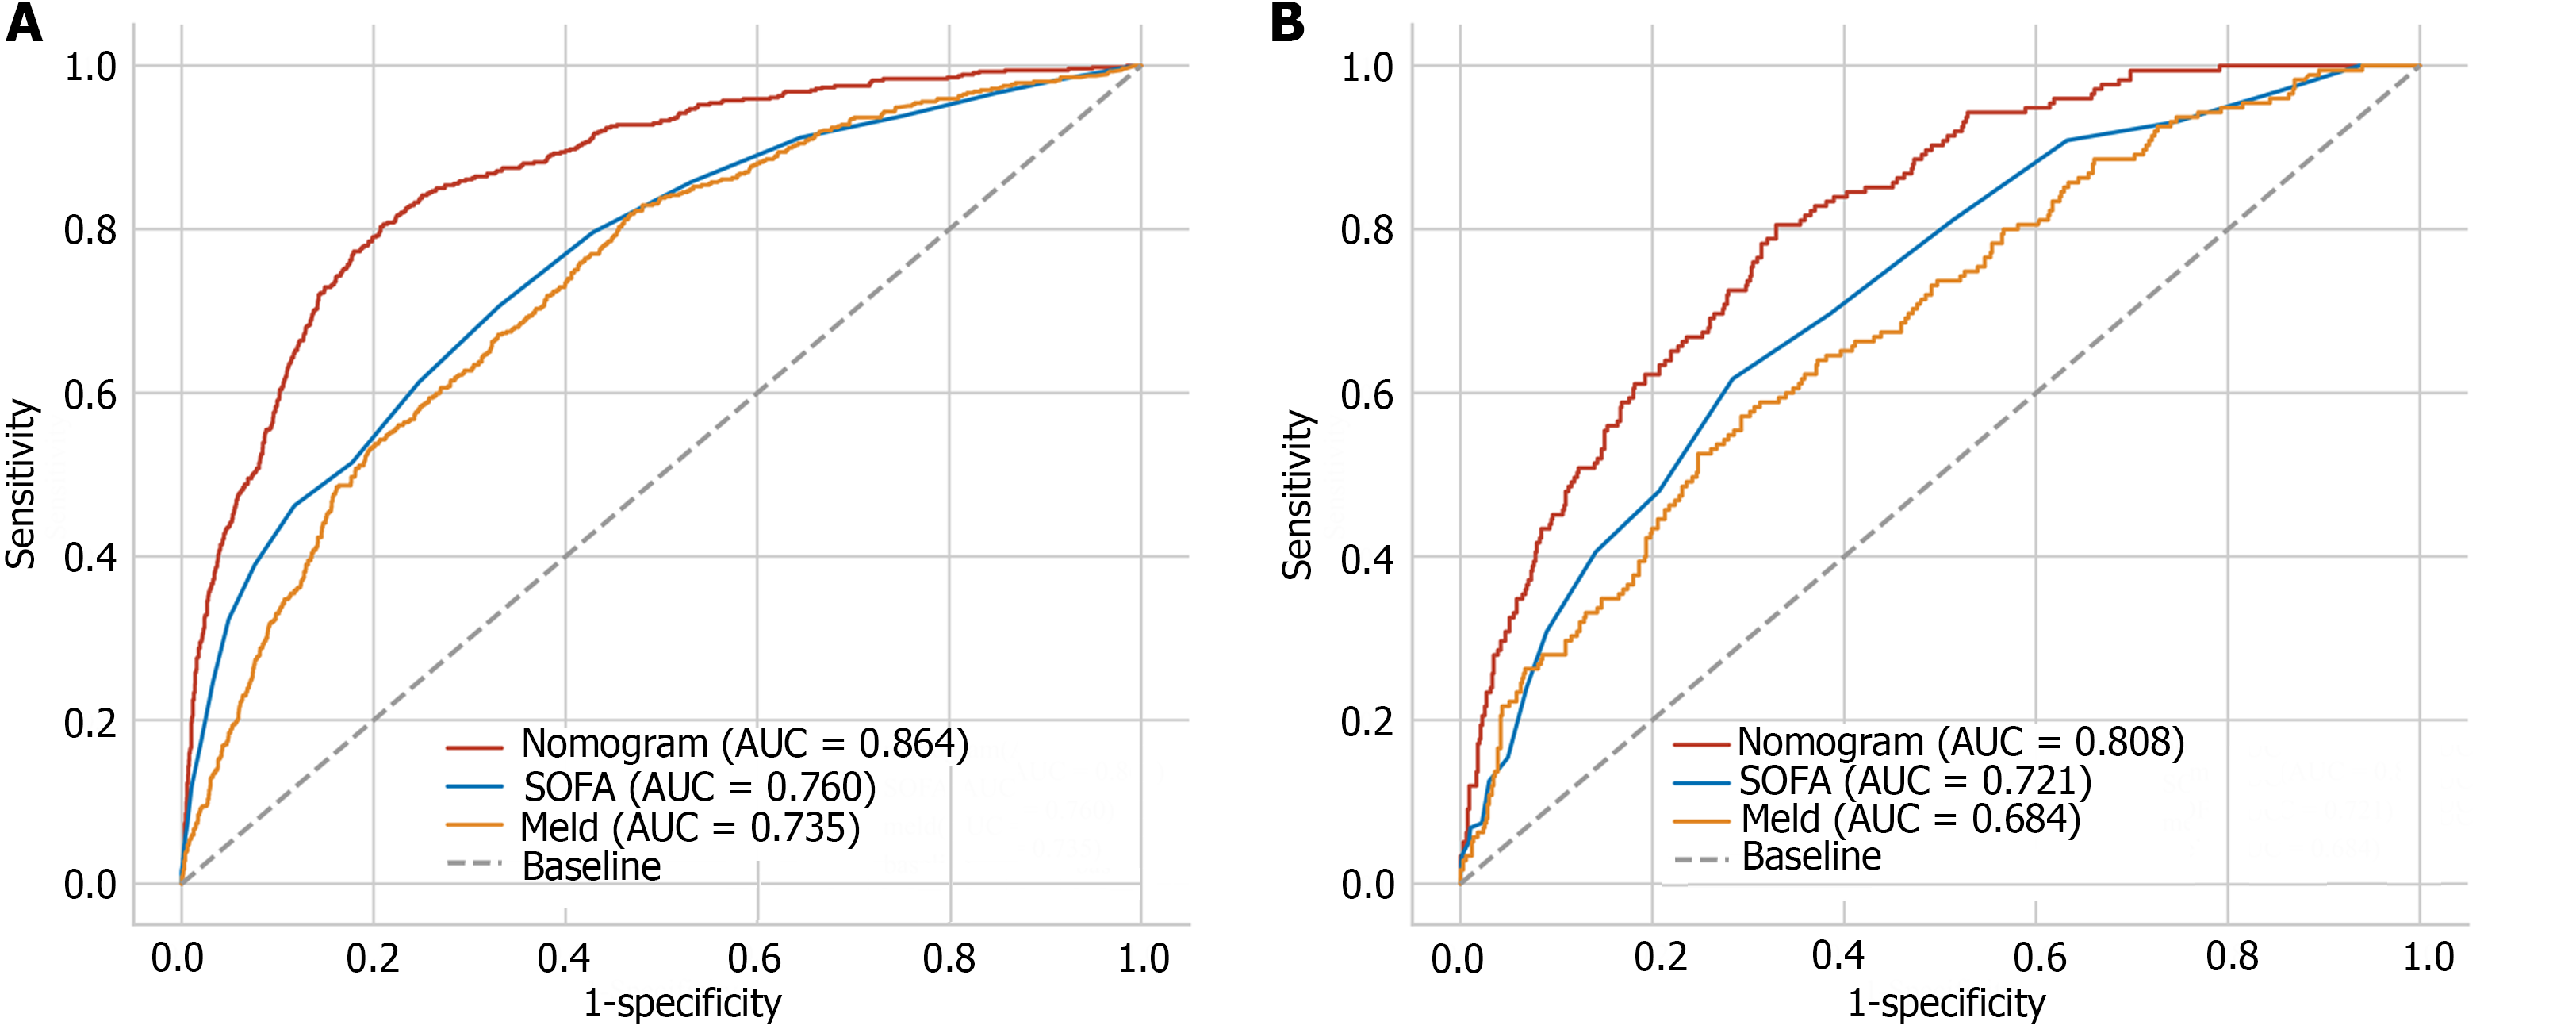
Figure 4 Receiver operating characteristic curves.
A: The training dataset; B: The test dataset. SOFA: Sequential organ failure assessment; AUC: The area under the receiver operating characteristic curve.
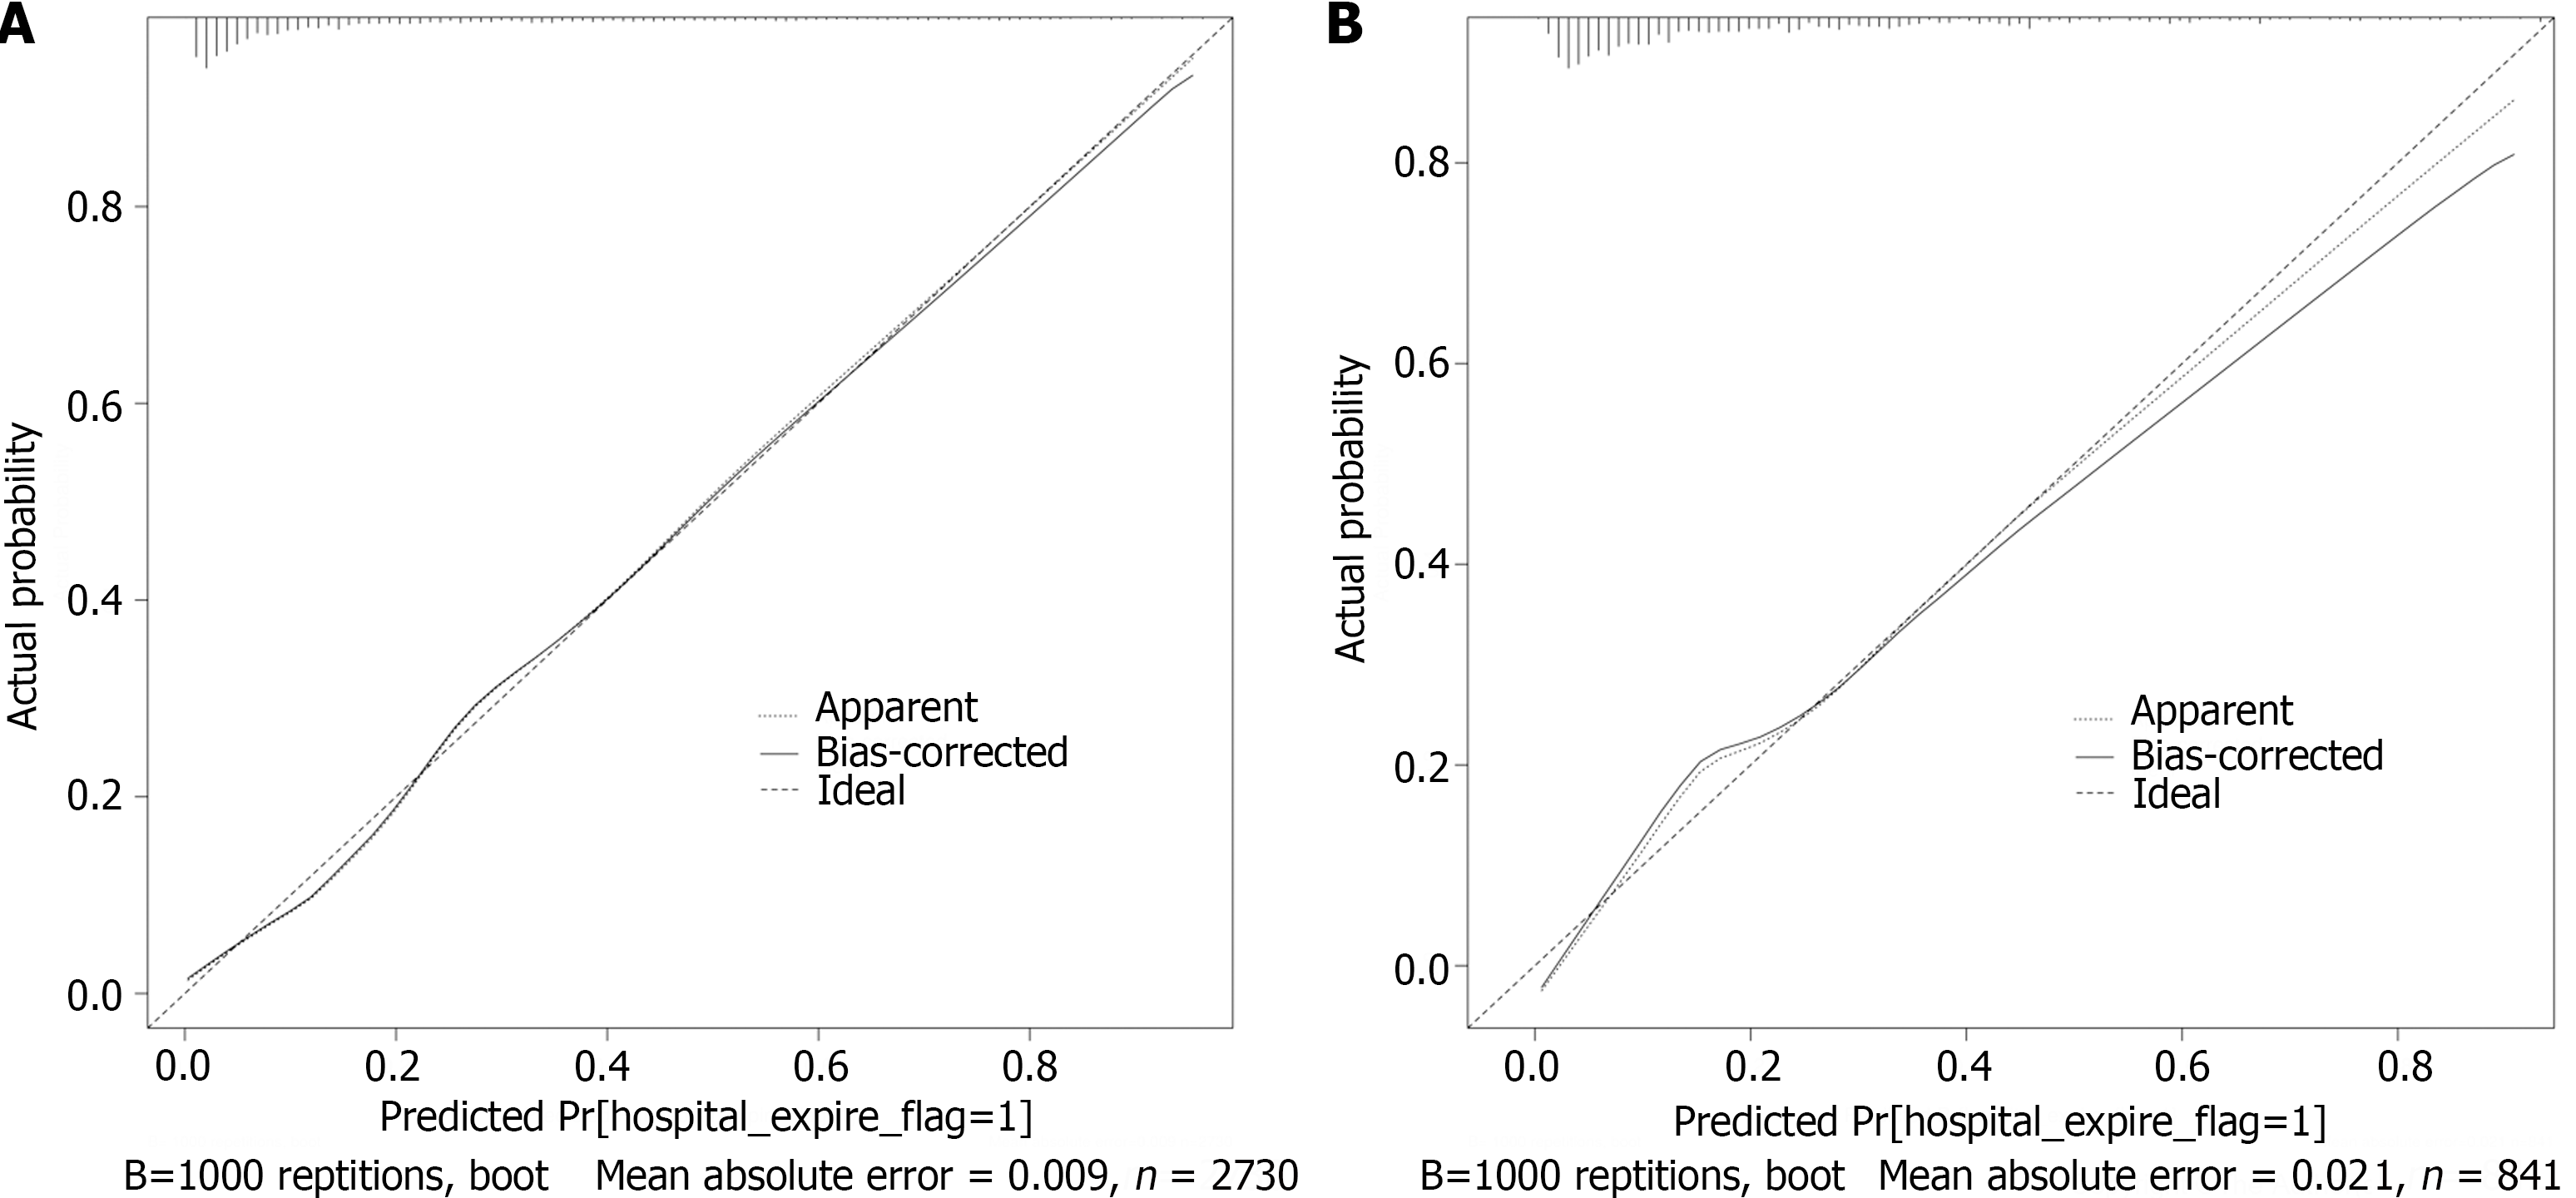
Figure 5 Calibration curves.
A: The training dataset; B: The test dataset. The X-axis and Y-axis represent the predicted and actual probability of hospital mortality, respectively. The apparent and bias-corrected lines show that the predicted probability and adjusted predicted probability fit the actual probability.
Figure 6 The decision curves.
A: The training dataset; B: The test dataset. SOFA: Sequential organ failure assessment; MELD: Model for End-stage Liver Disease.
- Citation: Tang XW, Ren WS, Huang S, Zou K, Xu H, Shi XM, Zhang W, Shi L, Lü MH. Development and validation of a nomogram for predicting in-hospital mortality of intensive care unit patients with liver cirrhosis. World J Hepatol 2024; 16(4): 625-639
- URL: https://www.wjgnet.com/1948-5182/full/v16/i4/625.htm
- DOI: https://dx.doi.org/10.4254/wjh.v16.i4.625


