Copyright
©The Author(s) 2023.
World J Hepatol. Mar 27, 2023; 15(3): 393-409
Published online Mar 27, 2023. doi: 10.4254/wjh.v15.i3.393
Published online Mar 27, 2023. doi: 10.4254/wjh.v15.i3.393
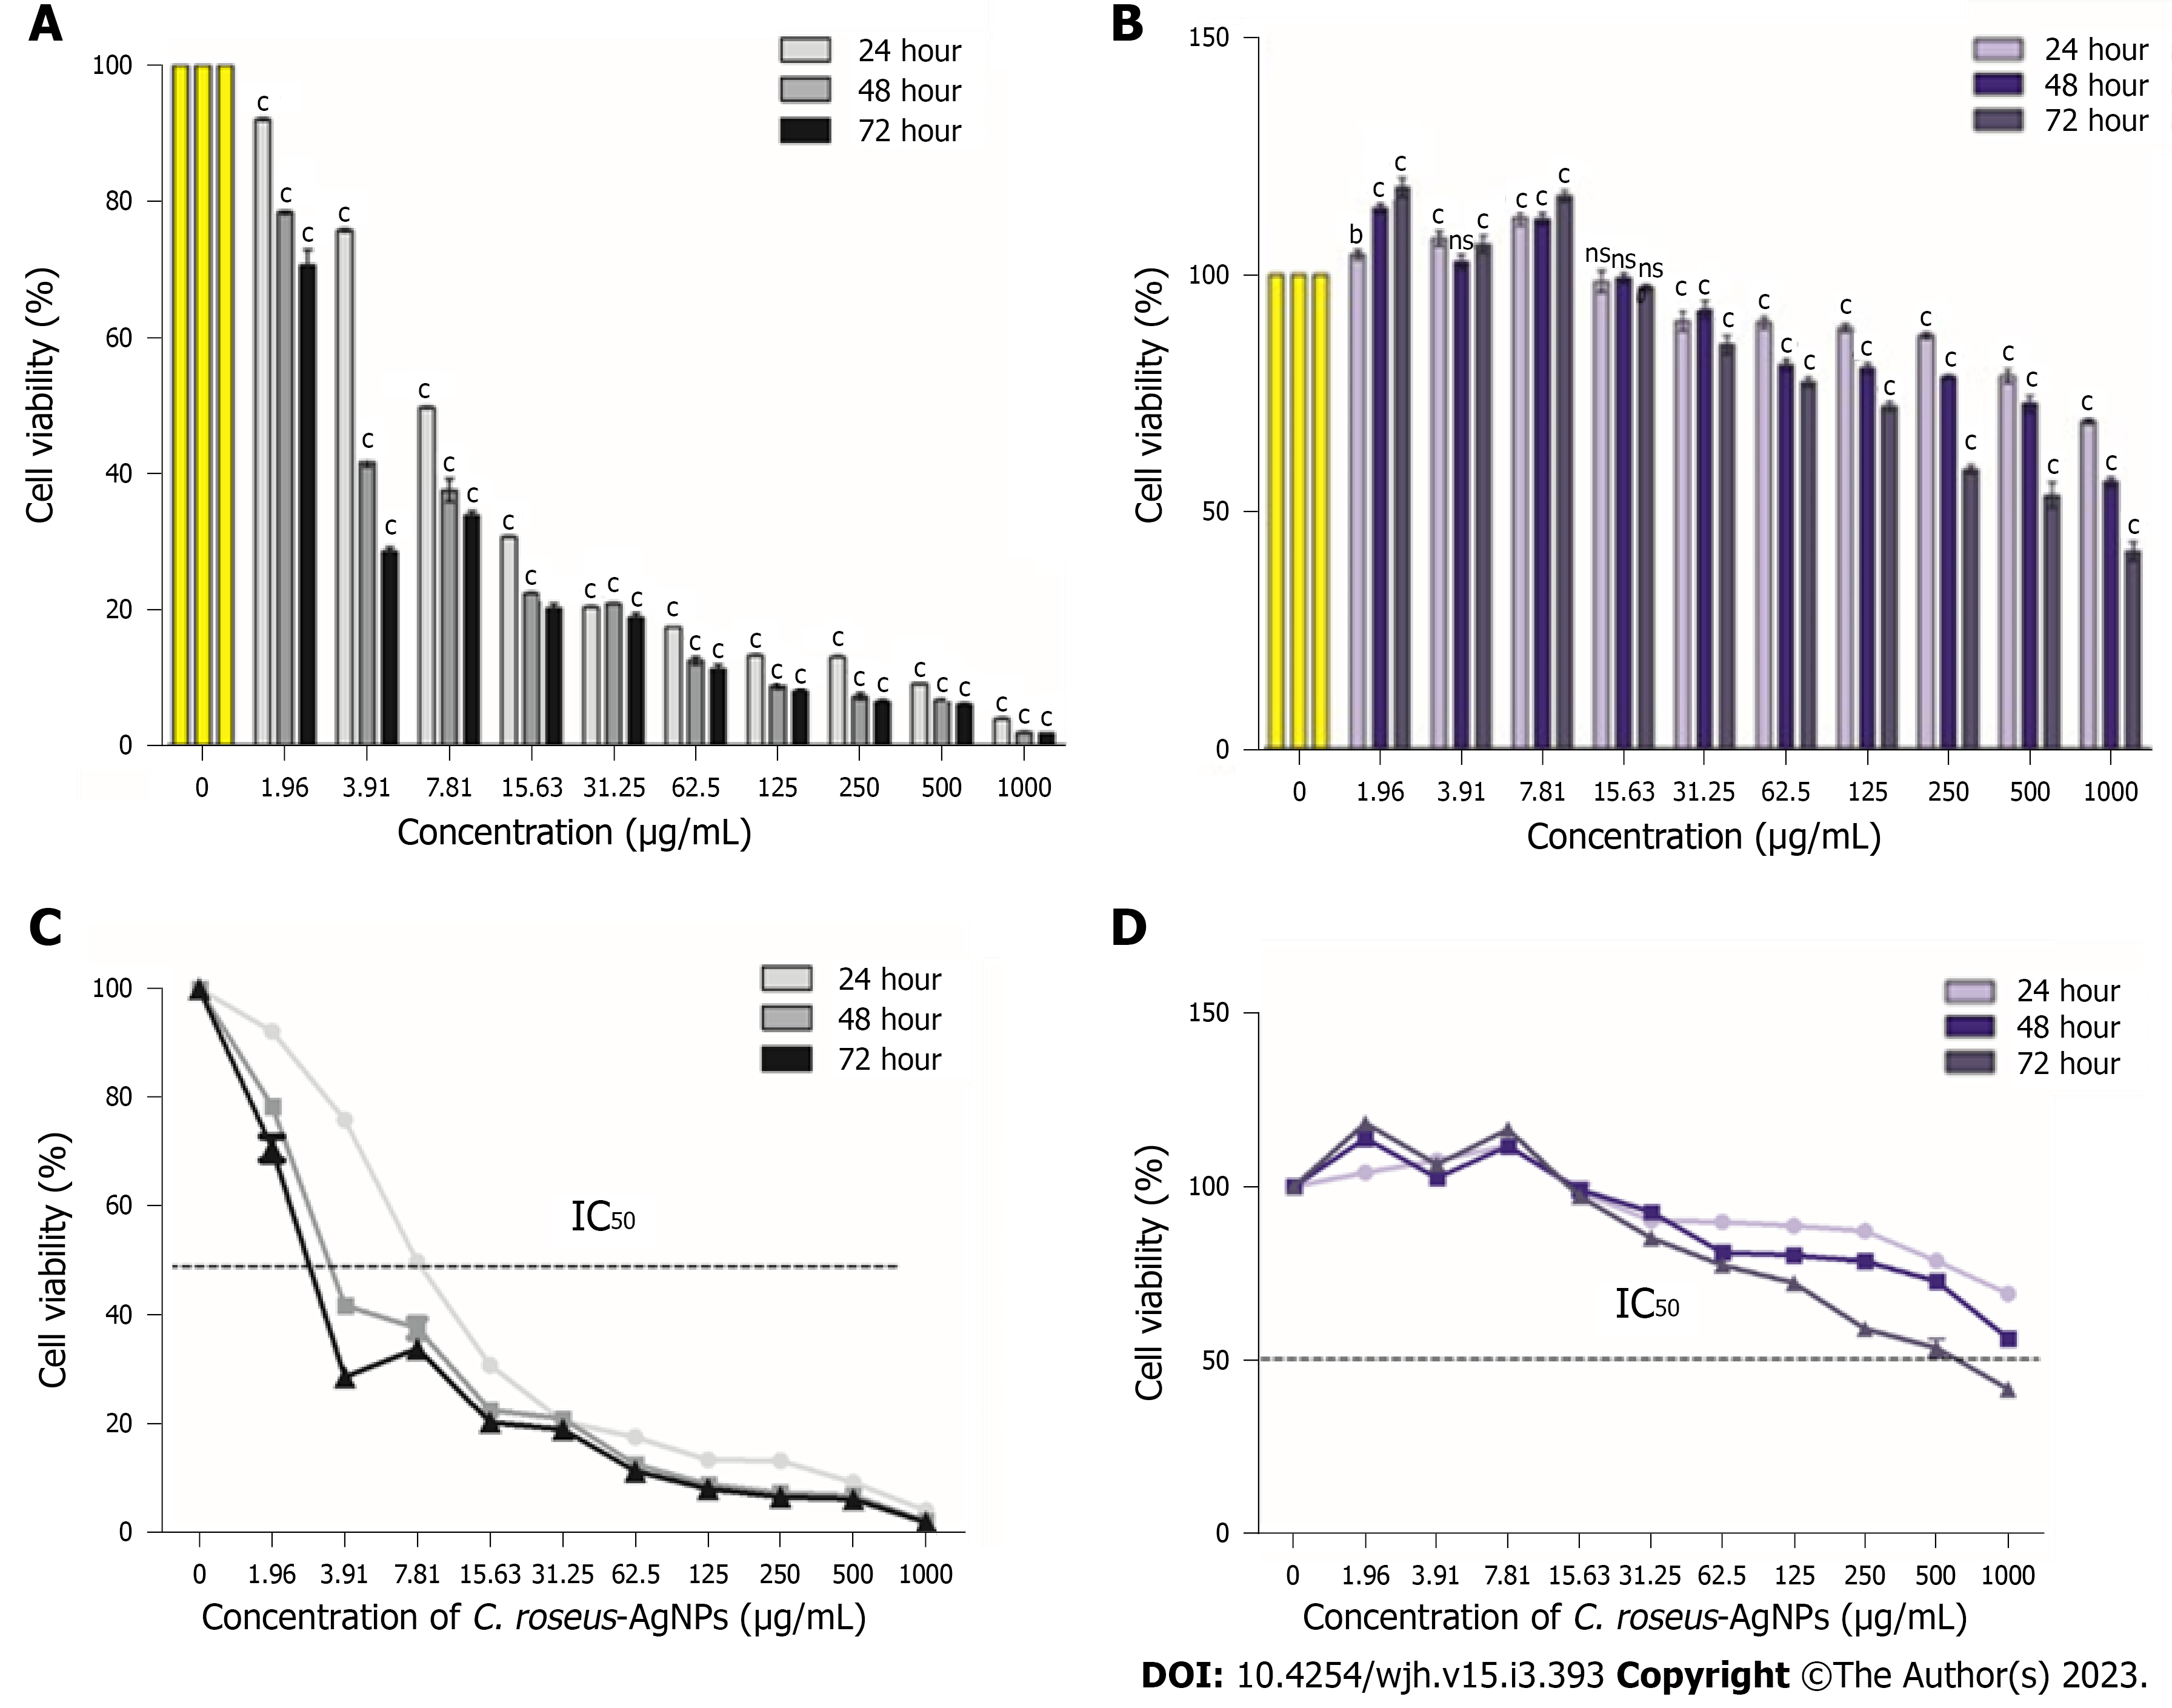
Figure 1 Cytotoxicity evaluation of Catharanthusroseus-silver nanoparticles on HepG2 and THLE-3 cells.
A: The cytotoxicity of HepG2 cell lines treated with different concentrations of Catharanthus roseus-silver nanoparticles (C. roseus-AgNPs); B: The IC50 of C. roseus-AgNPs on HepG2 cells; C: The cytotoxicity of THLE3 cell lines treated with different concentrations of C. roseus-AgNPs; D: The IC50 of C. roseus-AgNPs on THLE-3 cells. All experiments were done in triplicate, and the data represent means ± standard deviations. The comparison between each concentration with untreated cells was done using two-way ANOVA with Dunnet post-test to detect any significant differences (bP < 0.01; cP < 0.001; ns not significant). C. roseus-AgNPs: Catharanthus roseus-silver nanoparticles.
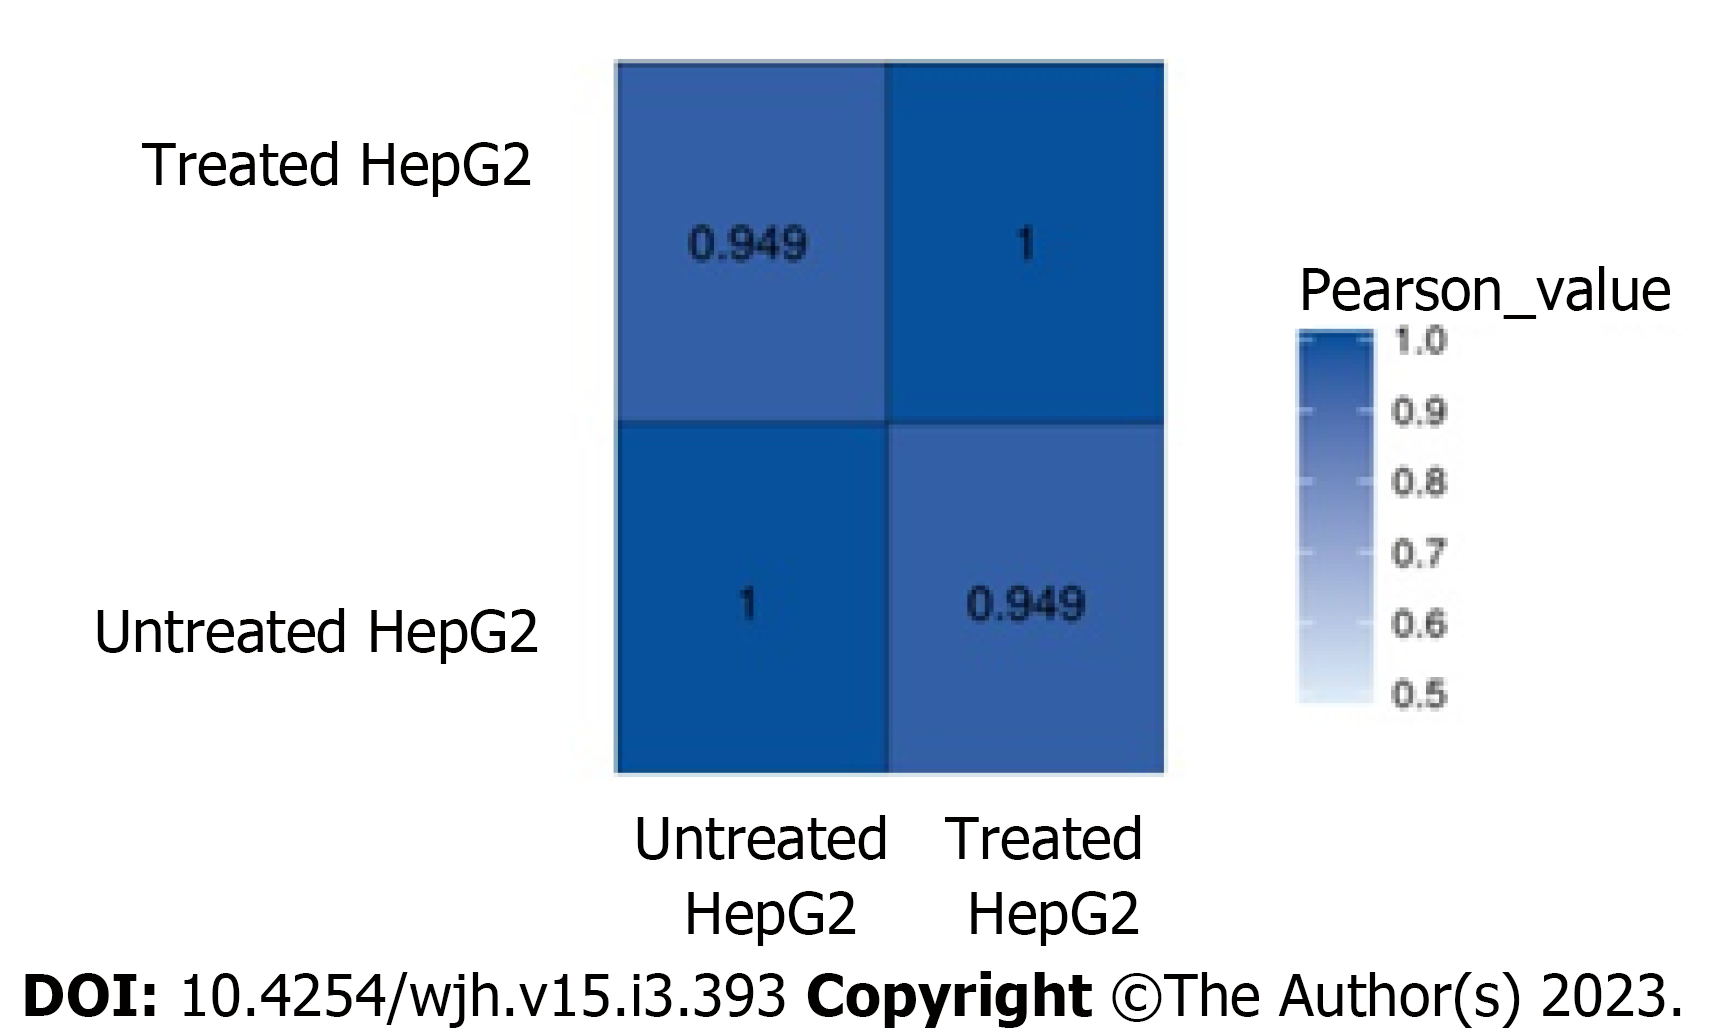
Figure 2 The correlation analysis between samples.
The colour represents the correlation coefficient.
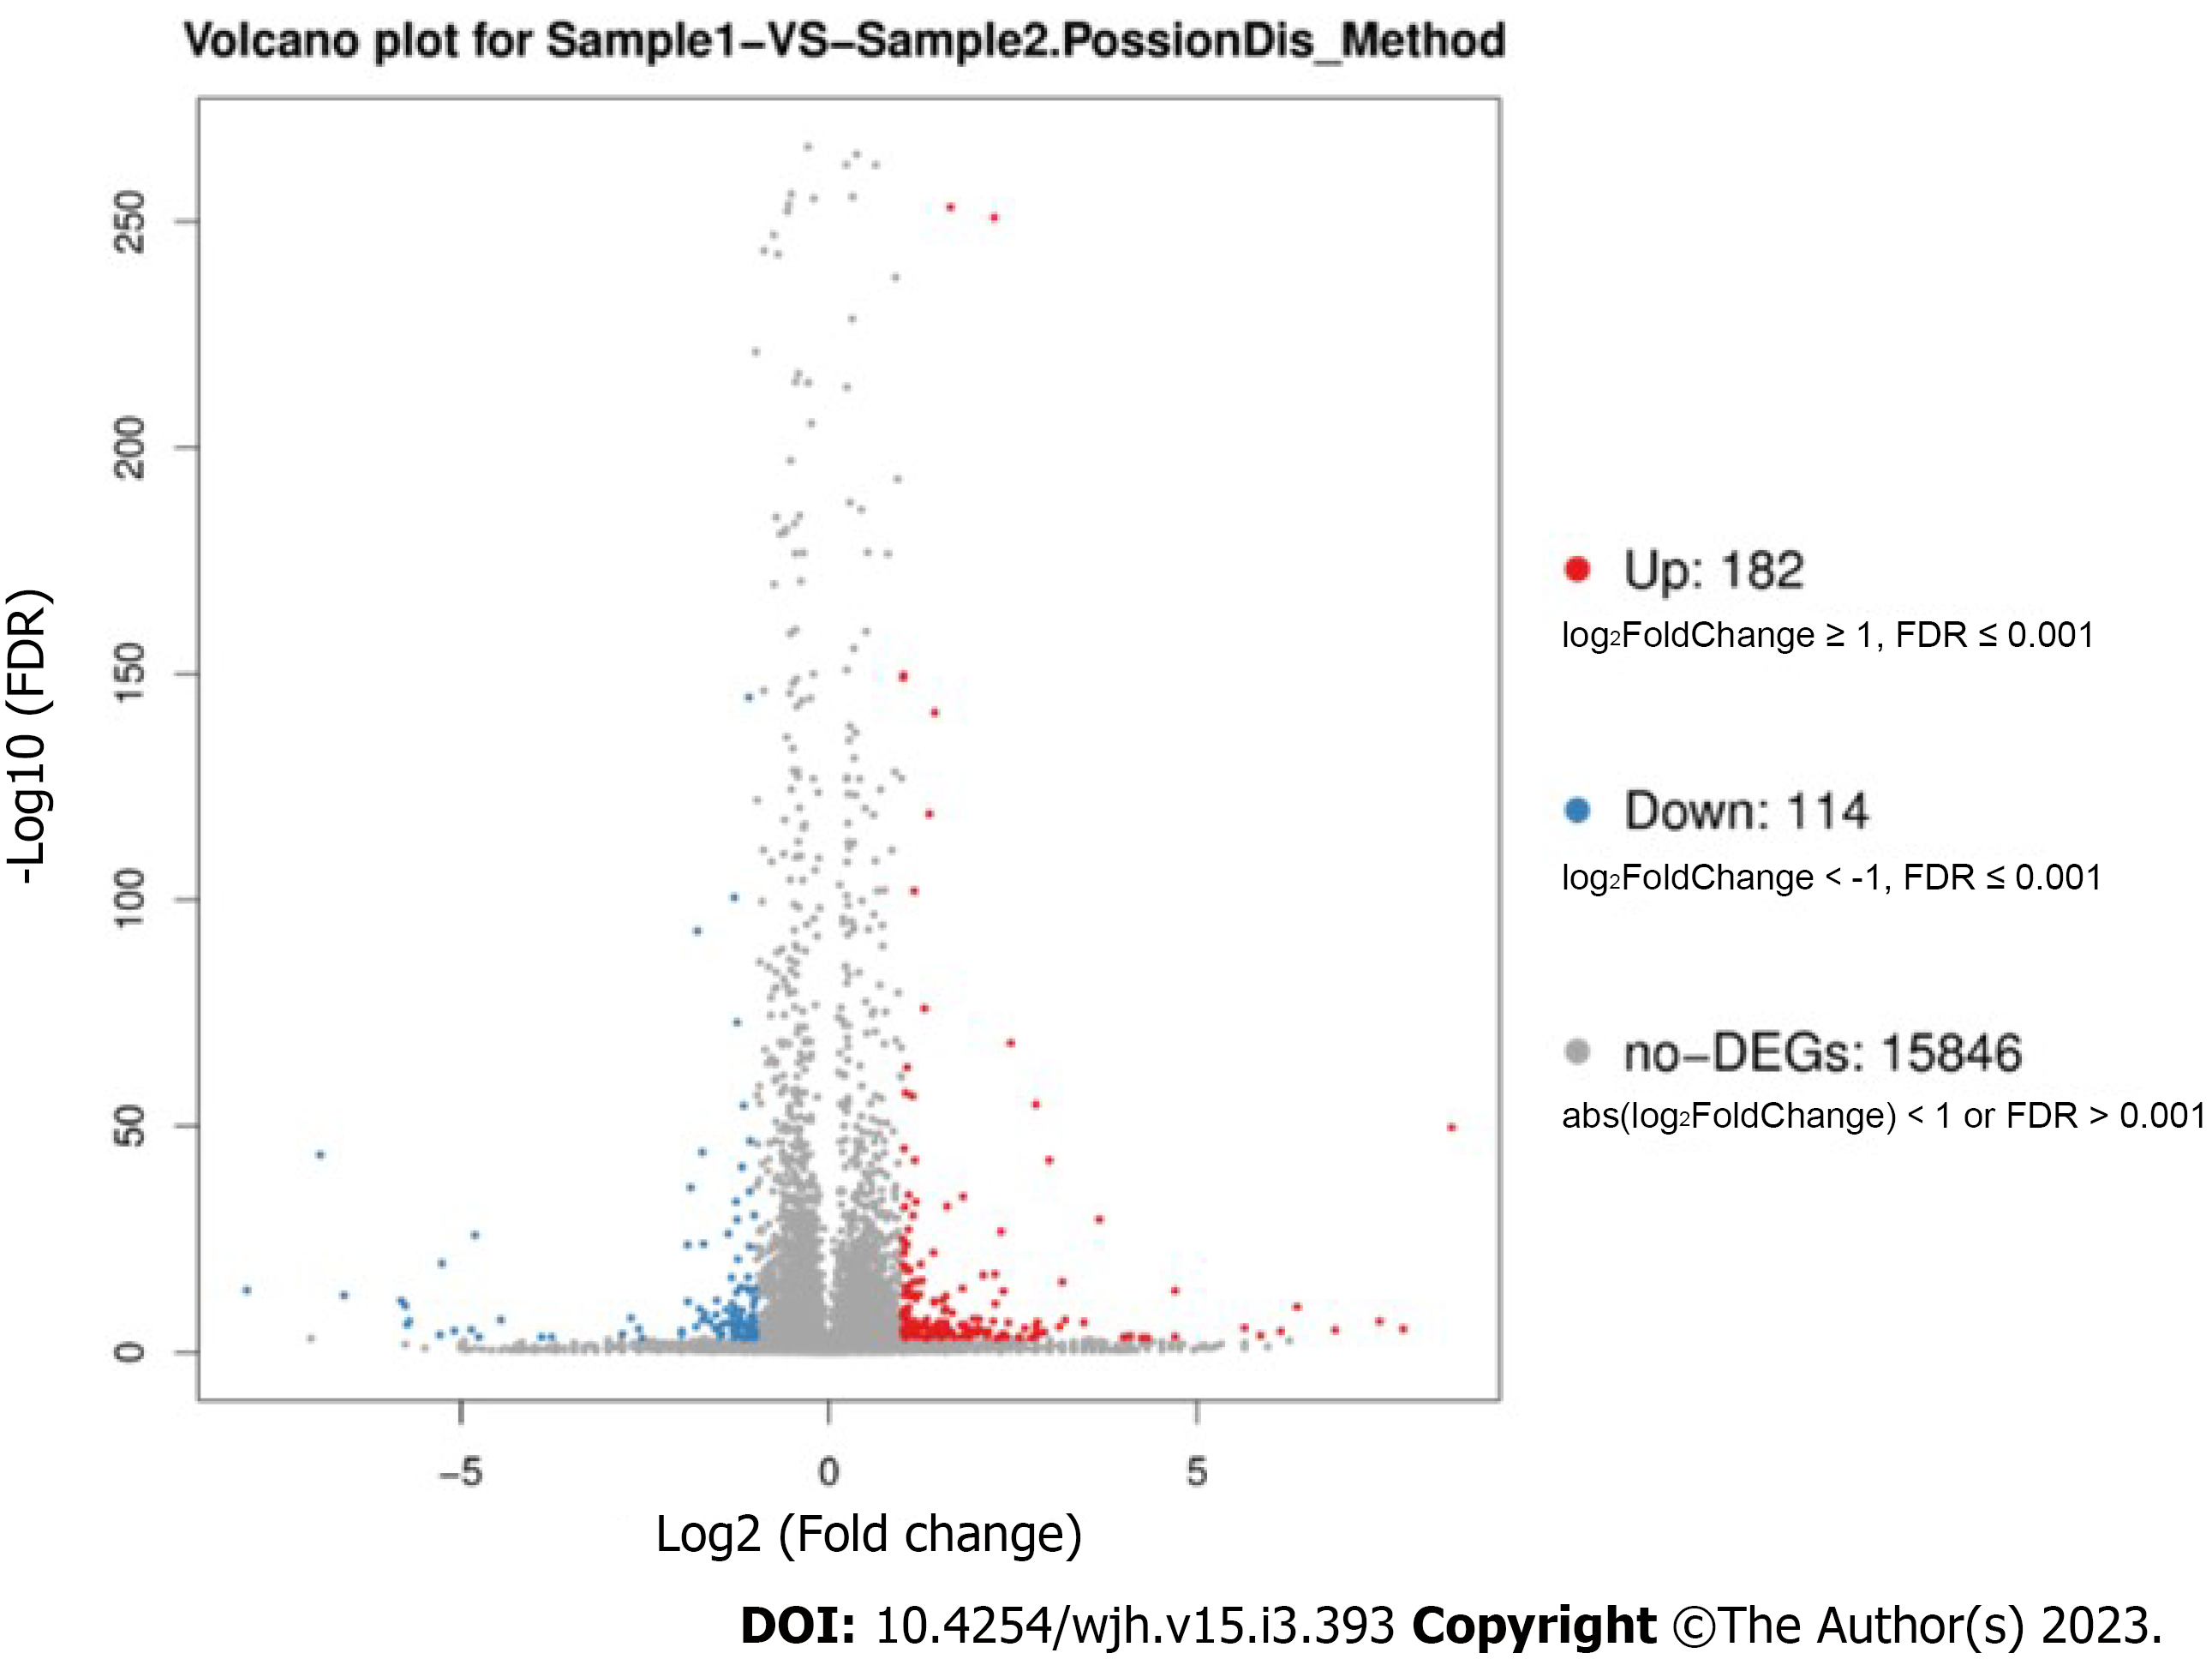
Figure 3 Volcano plot of differentially expression genes.
Red points represent upregulated differentially expression genes (DEGs). Blue points represent down-regulated DEGs. Grey points represent non-DEGs. DEGs: Differentially expression genes.
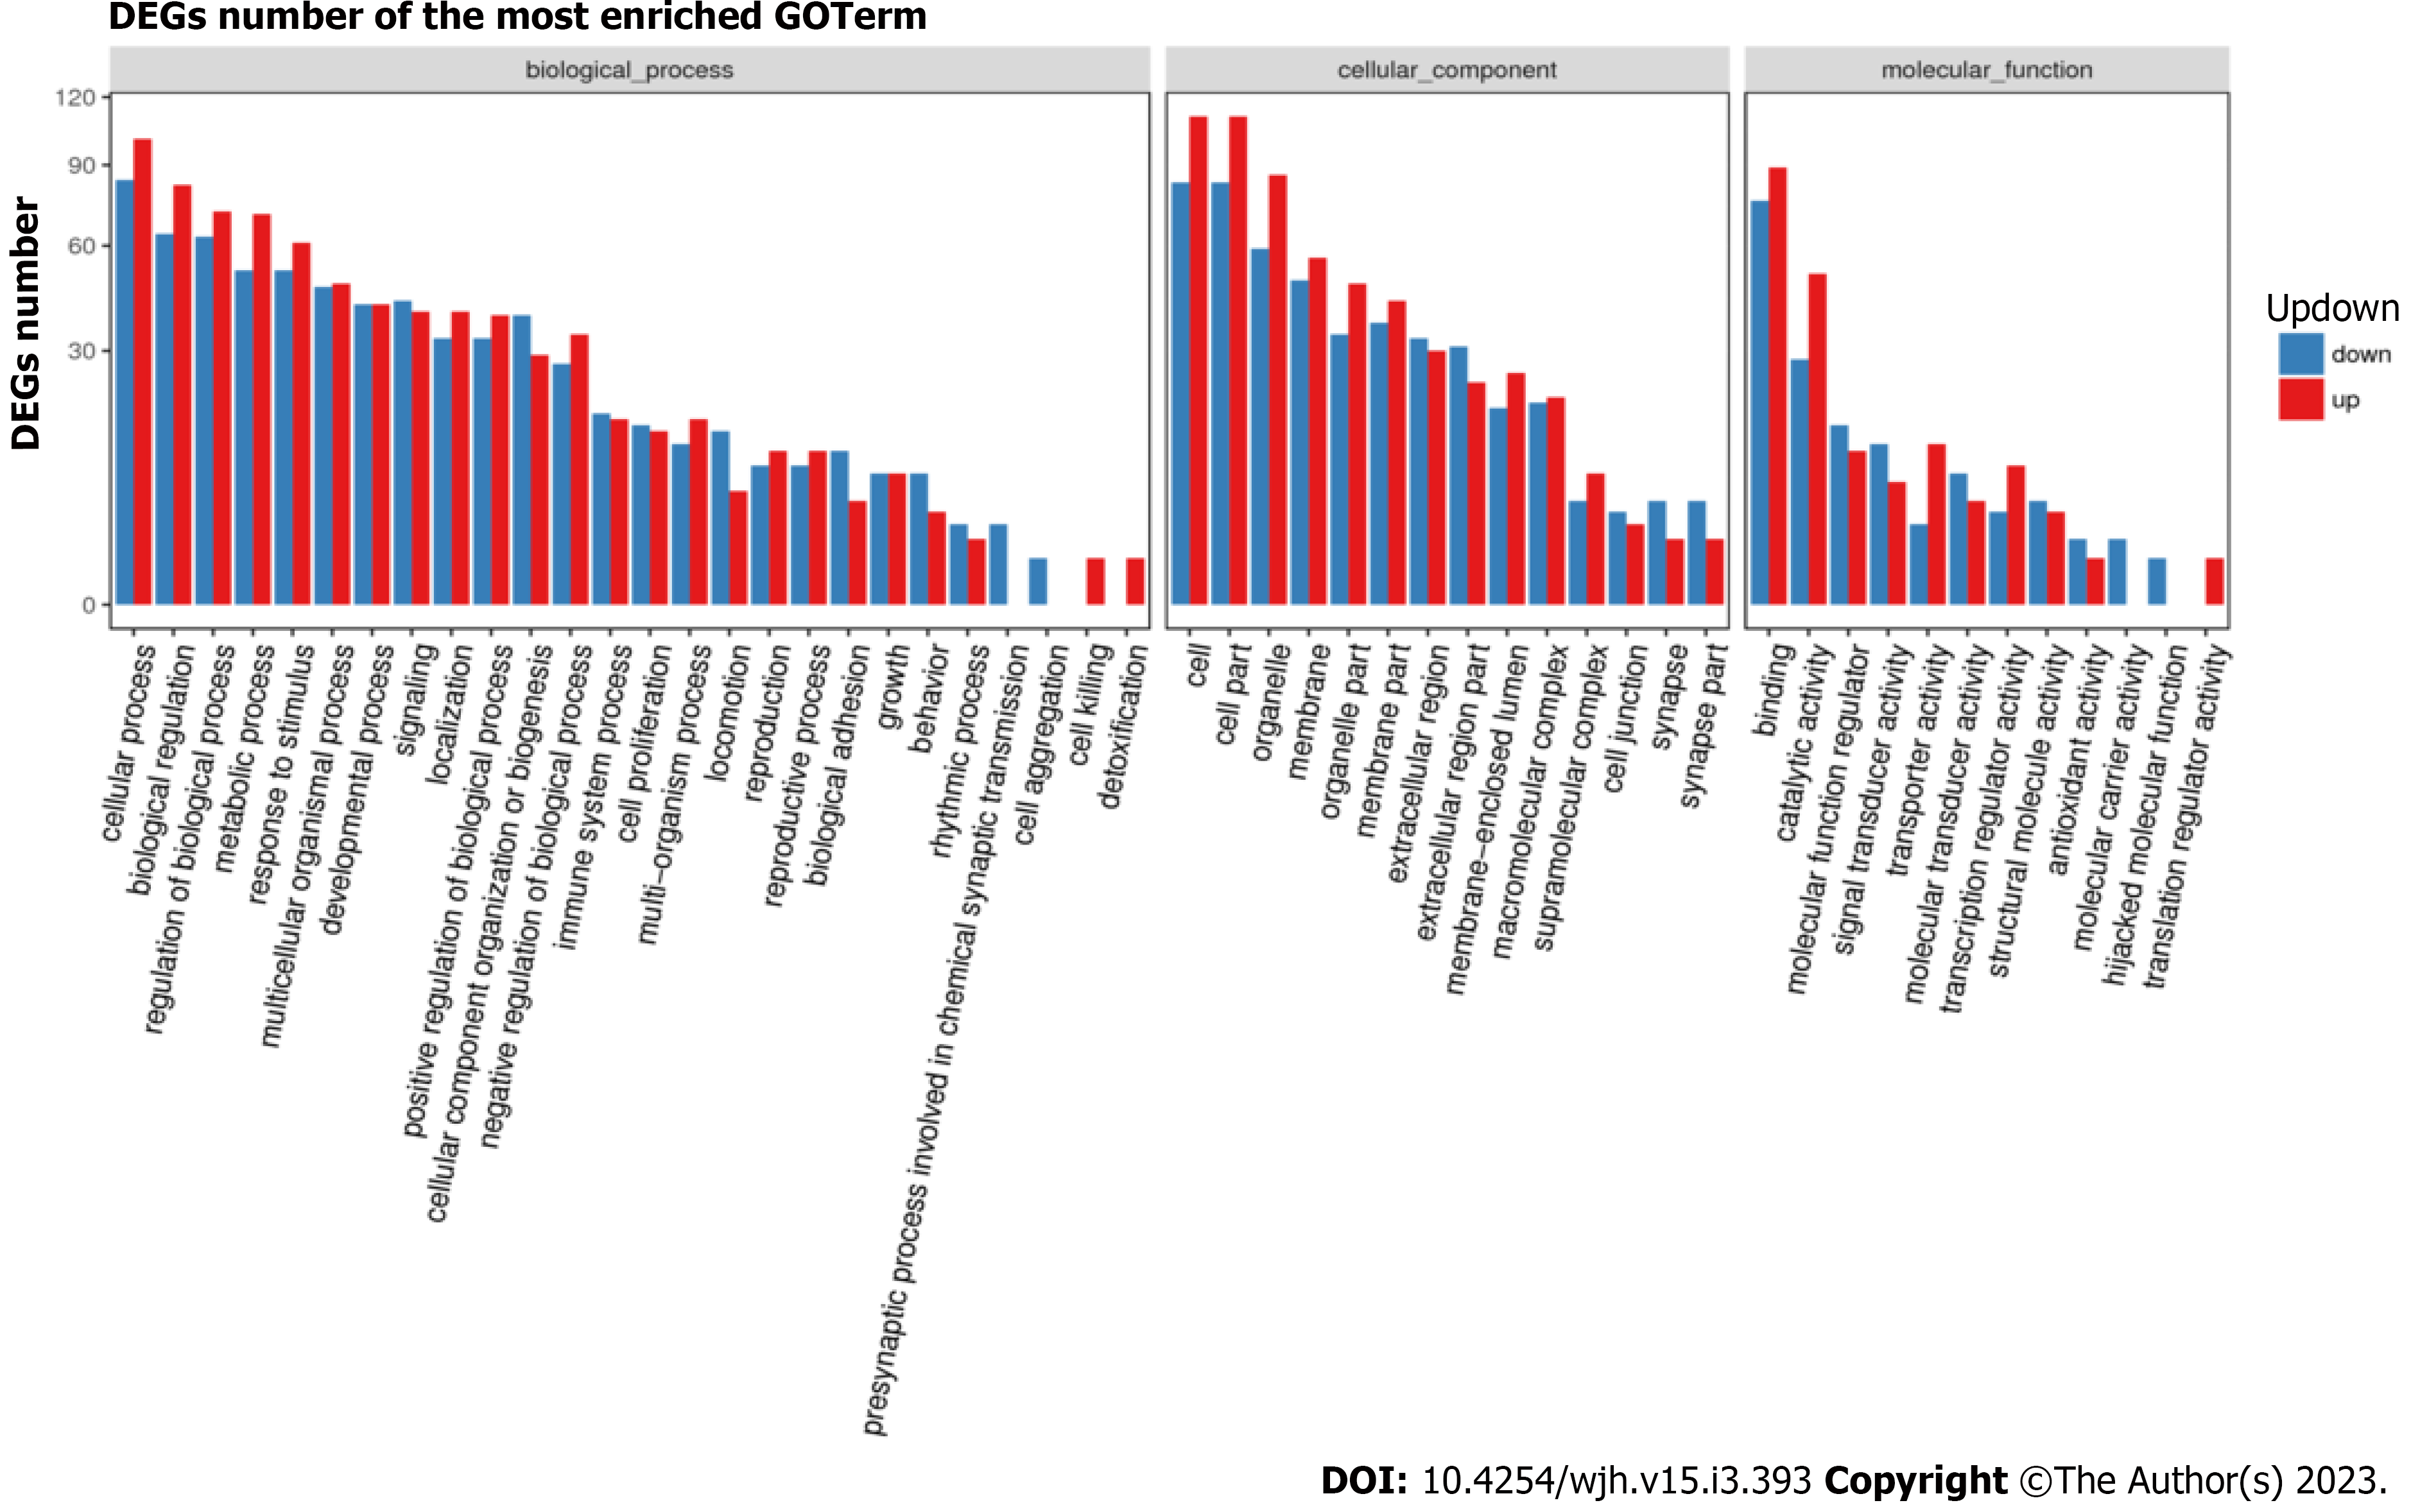
Figure 4 Gene Ontology classification of upregulated and downregulated differentially expression genes.
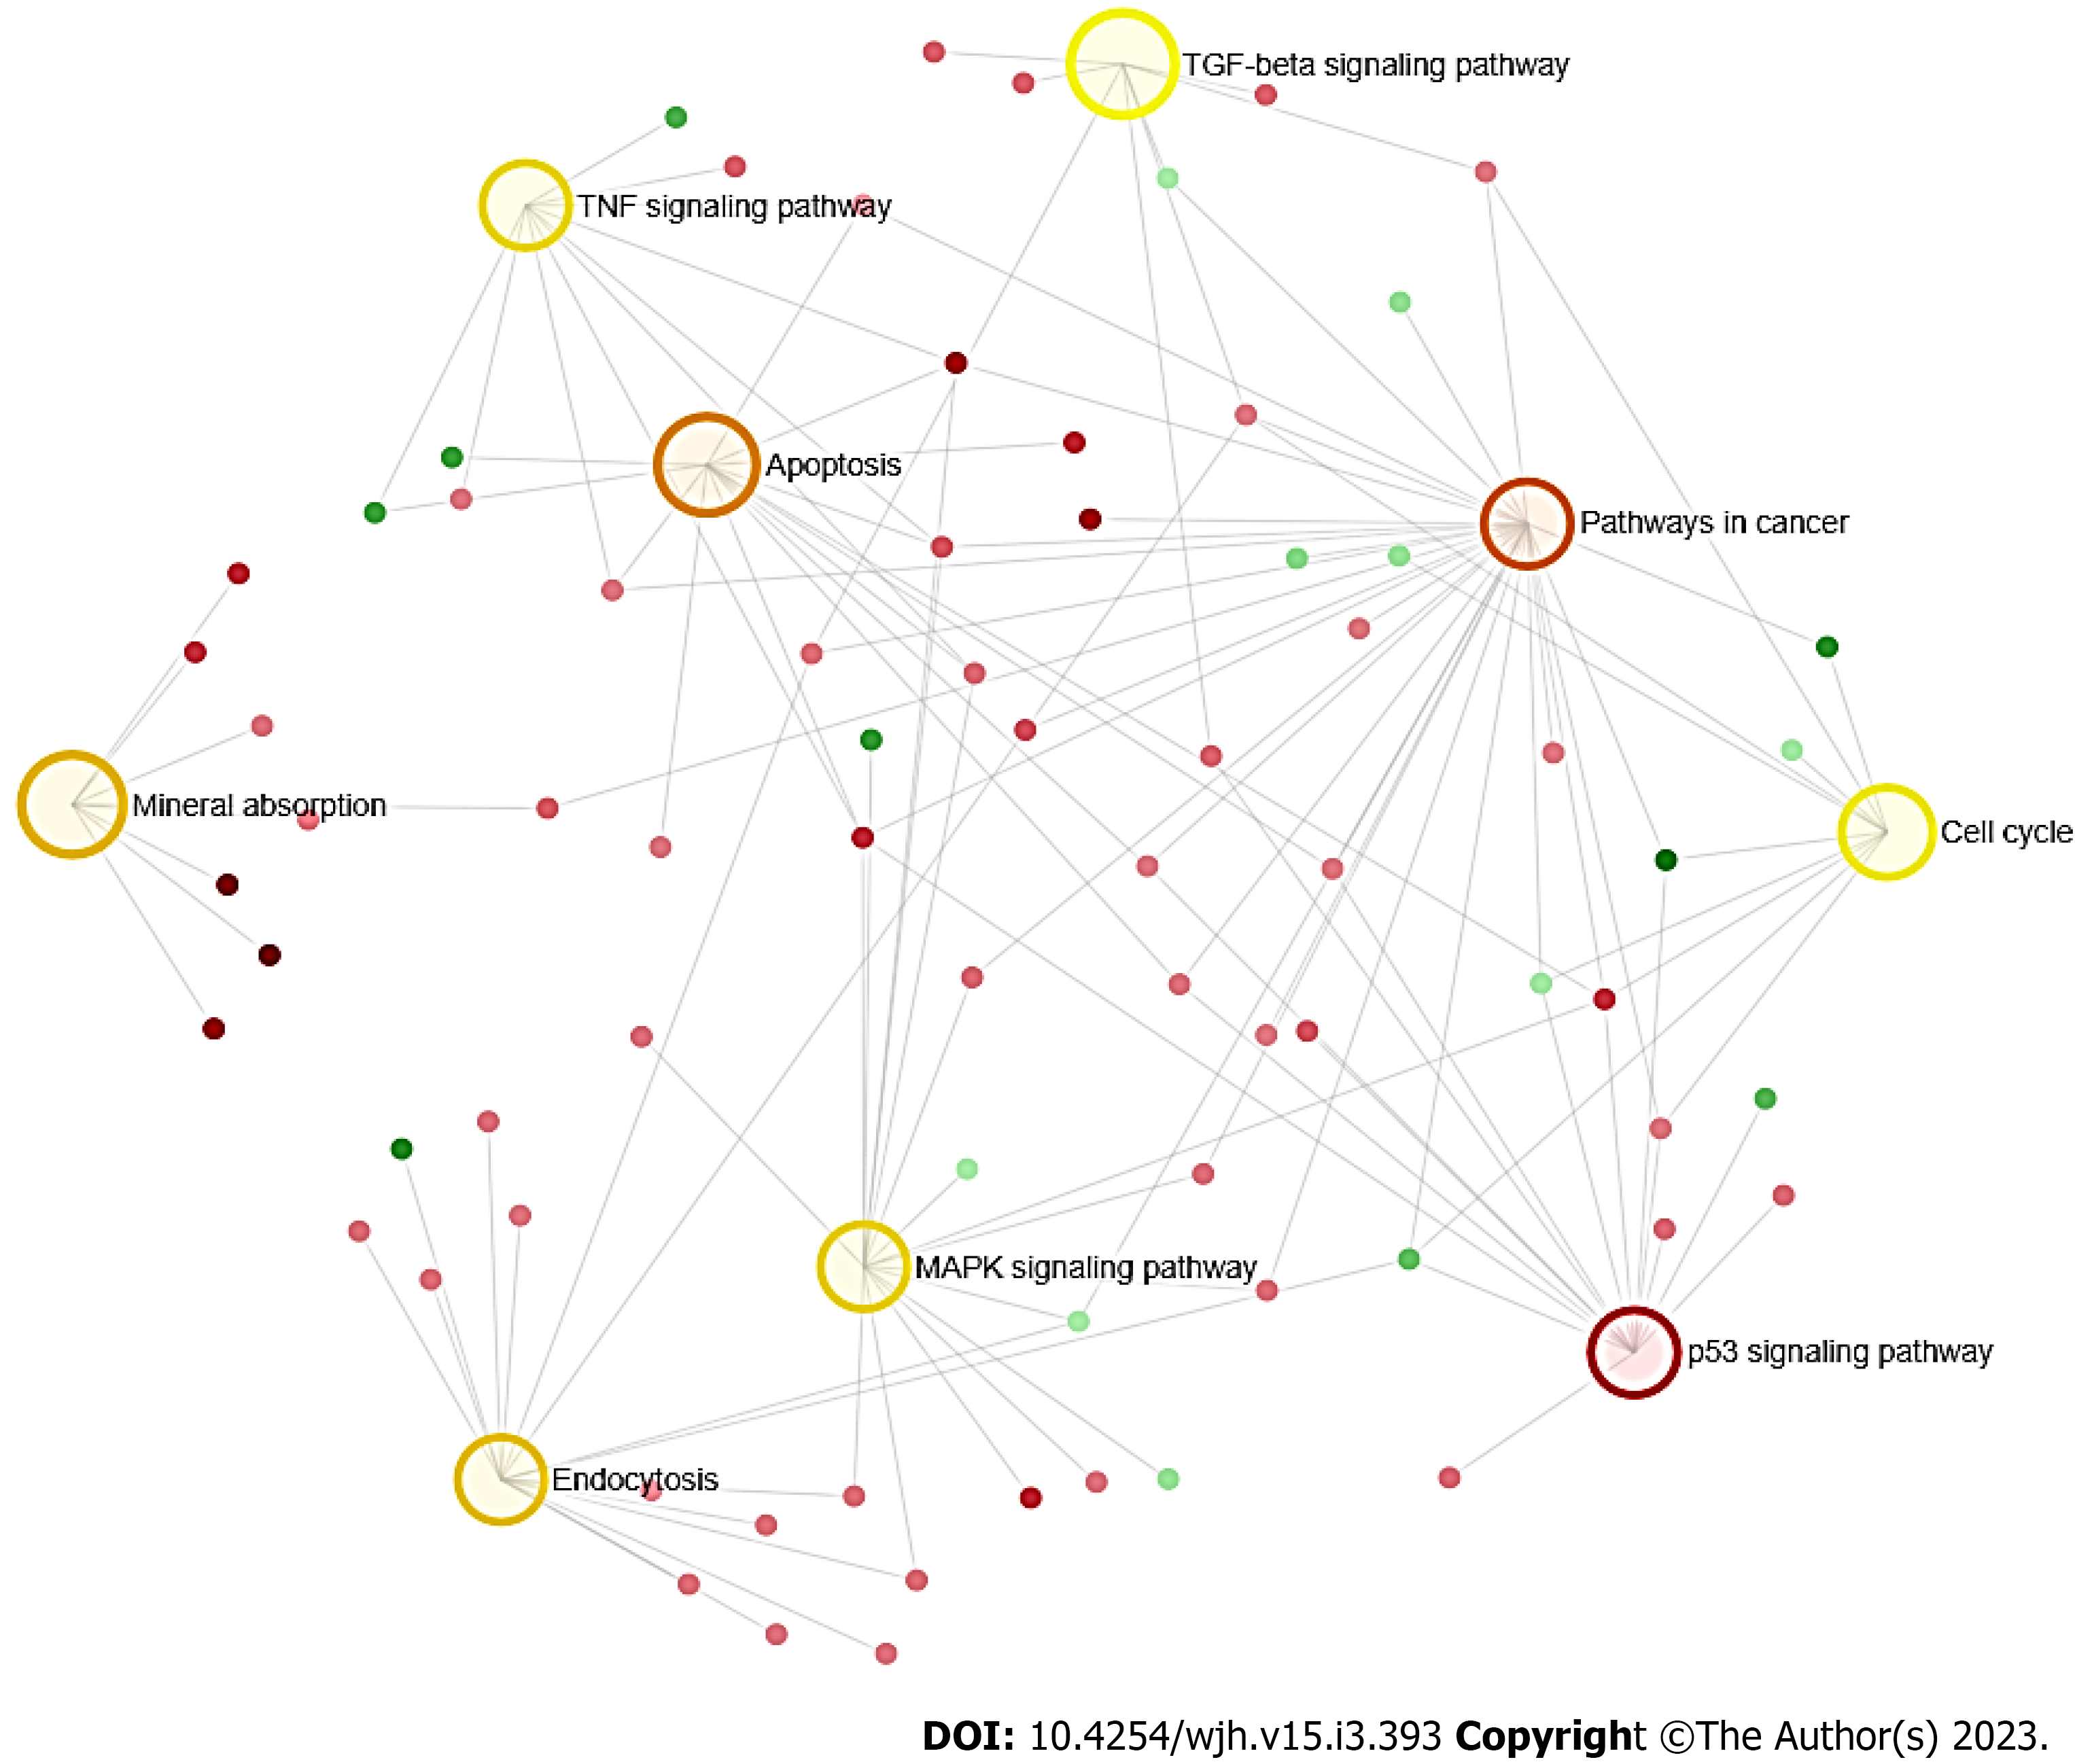
Figure 5 Network enrichment result.
The darker the colour indicates the highest enrichment pathways. The larger the area, the higher the degree of enrichment.
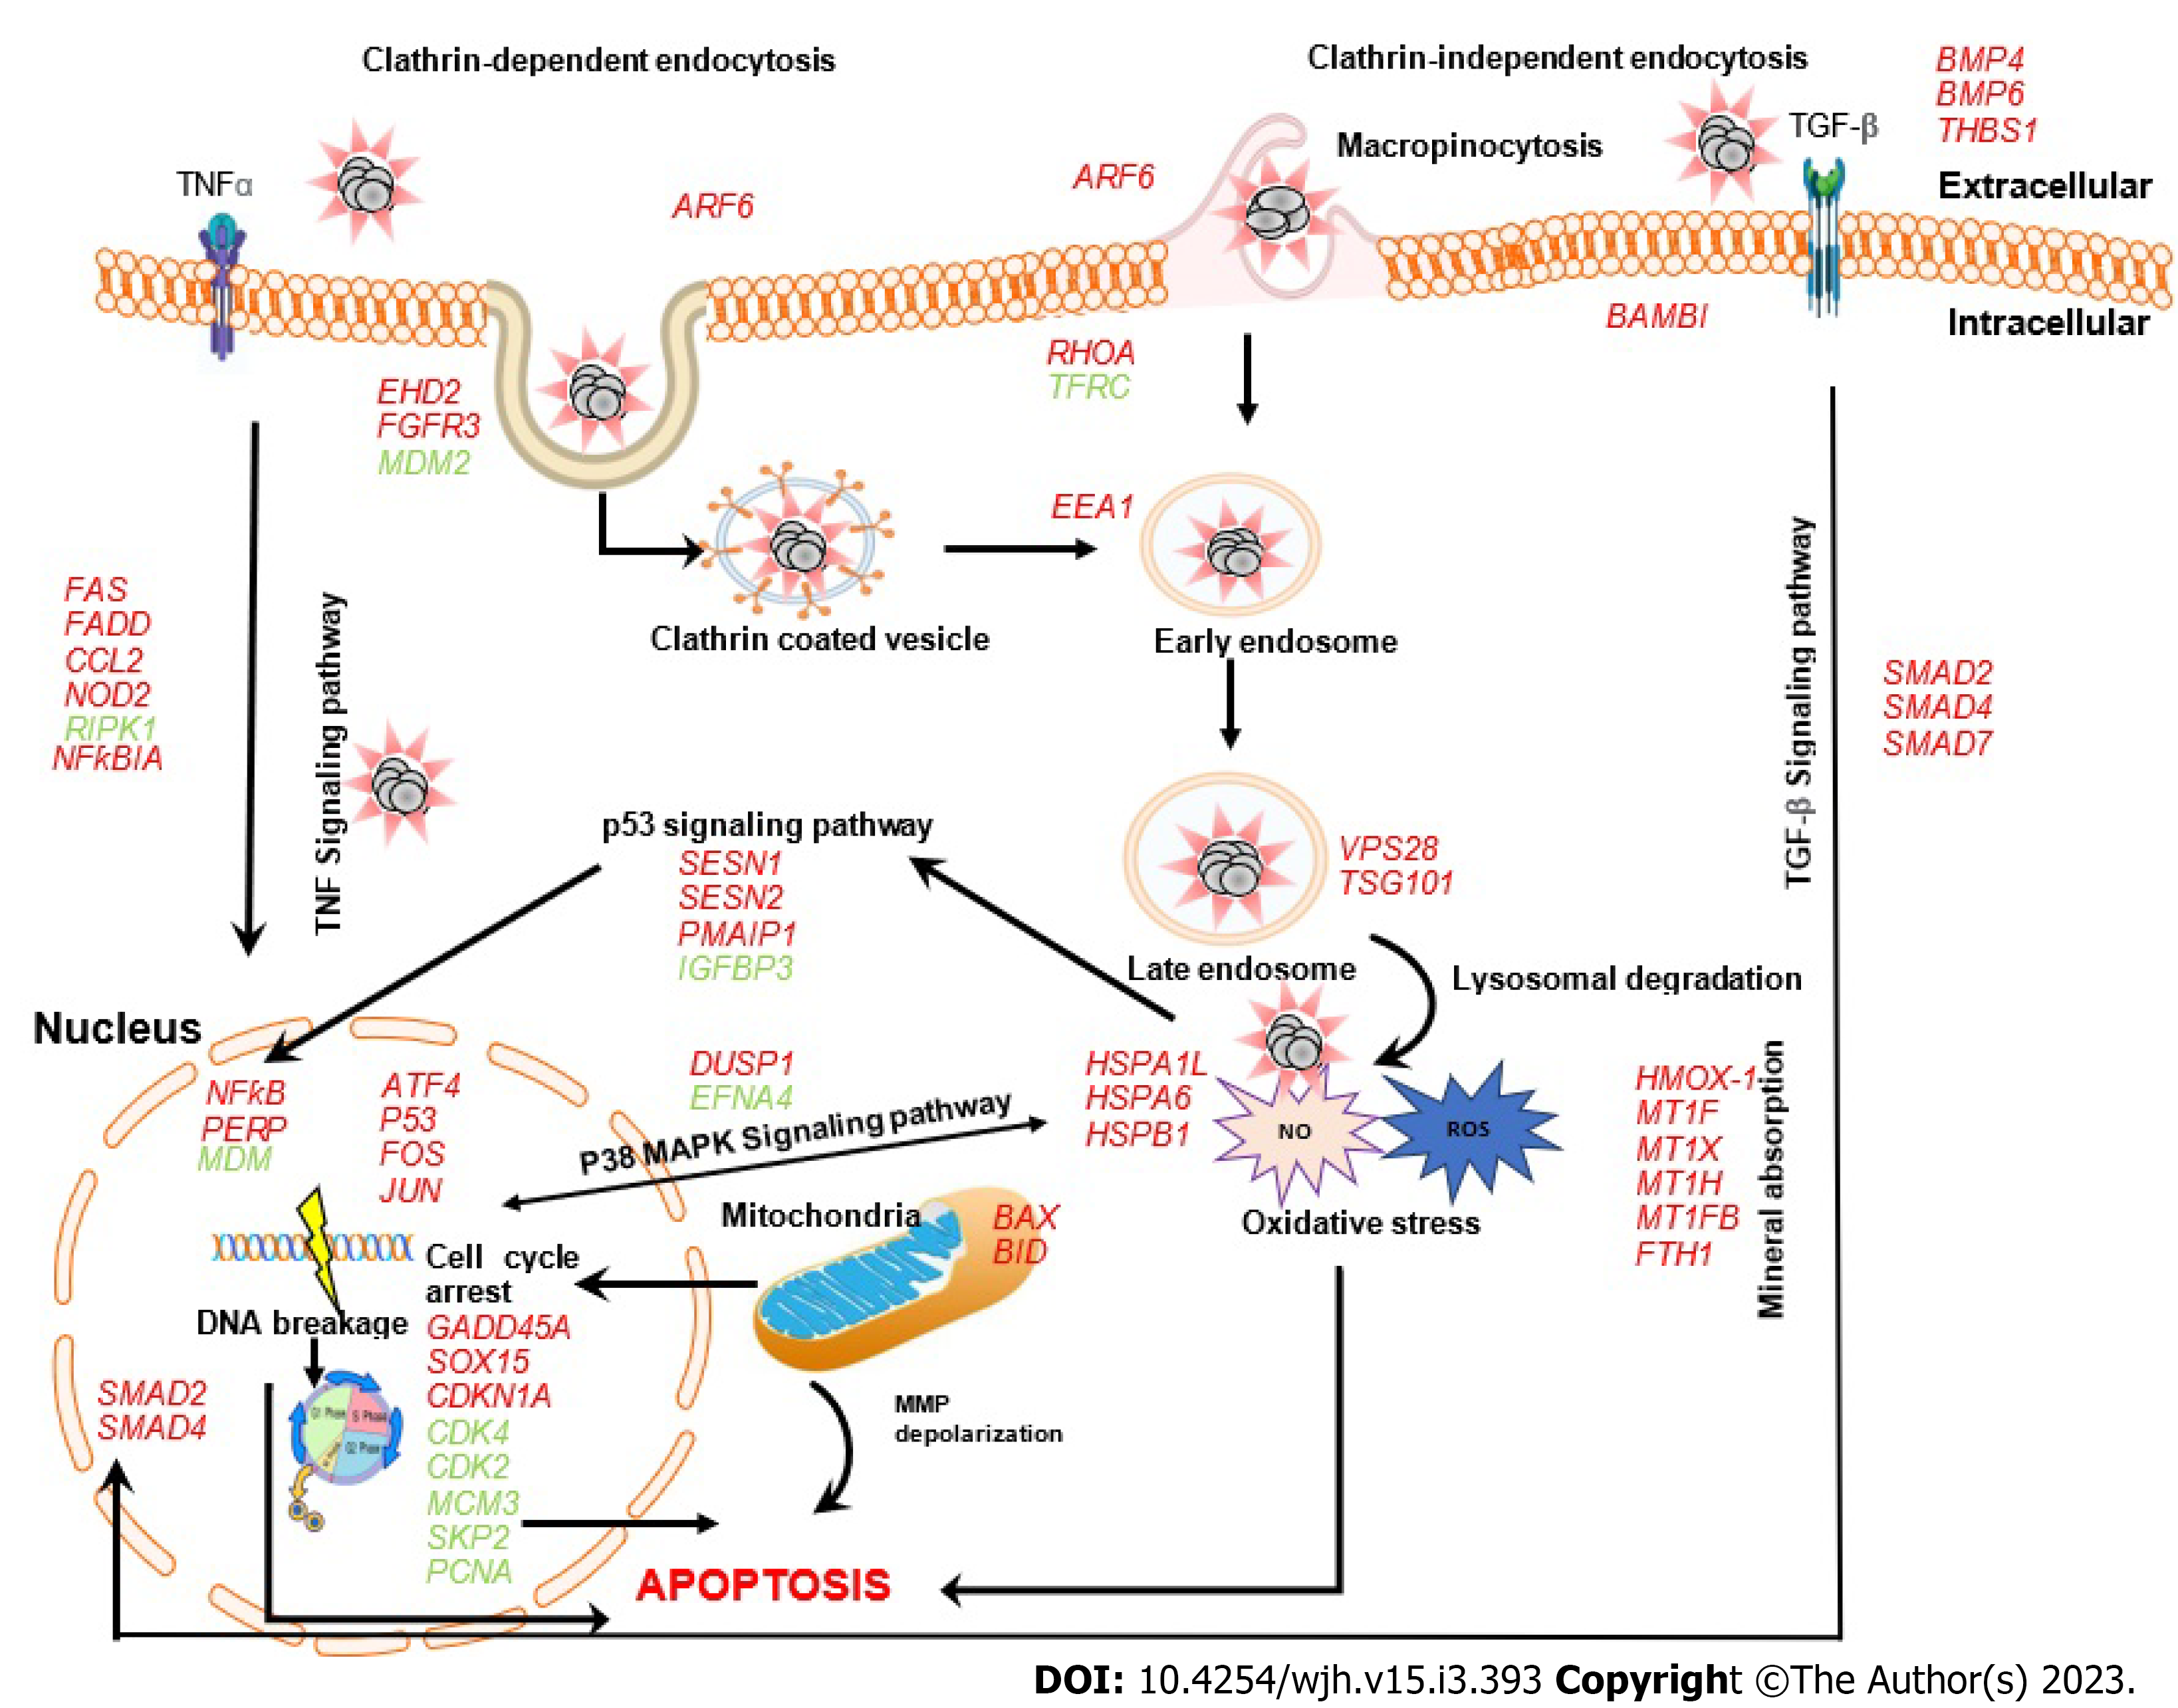
Figure 6 Model of cytotoxicity mechanism in HepG2 cell treated with C.
roseus-AgNPs that involves the upregulated genes (in red) and downregulated genes (in green).
- Citation: Azhar NA, Abu Bakar SA, Citartan M, Ahmad NH. mRNA transcriptome profiling of human hepatocellular carcinoma cells HepG2 treated with Catharanthus roseus-silver nanoparticles. World J Hepatol 2023; 15(3): 393-409
- URL: https://www.wjgnet.com/1948-5182/full/v15/i3/393.htm
- DOI: https://dx.doi.org/10.4254/wjh.v15.i3.393


