Copyright
©The Author(s) 2020.
World J Hepatol. Nov 27, 2020; 12(11): 1076-1088
Published online Nov 27, 2020. doi: 10.4254/wjh.v12.i11.1076
Published online Nov 27, 2020. doi: 10.4254/wjh.v12.i11.1076
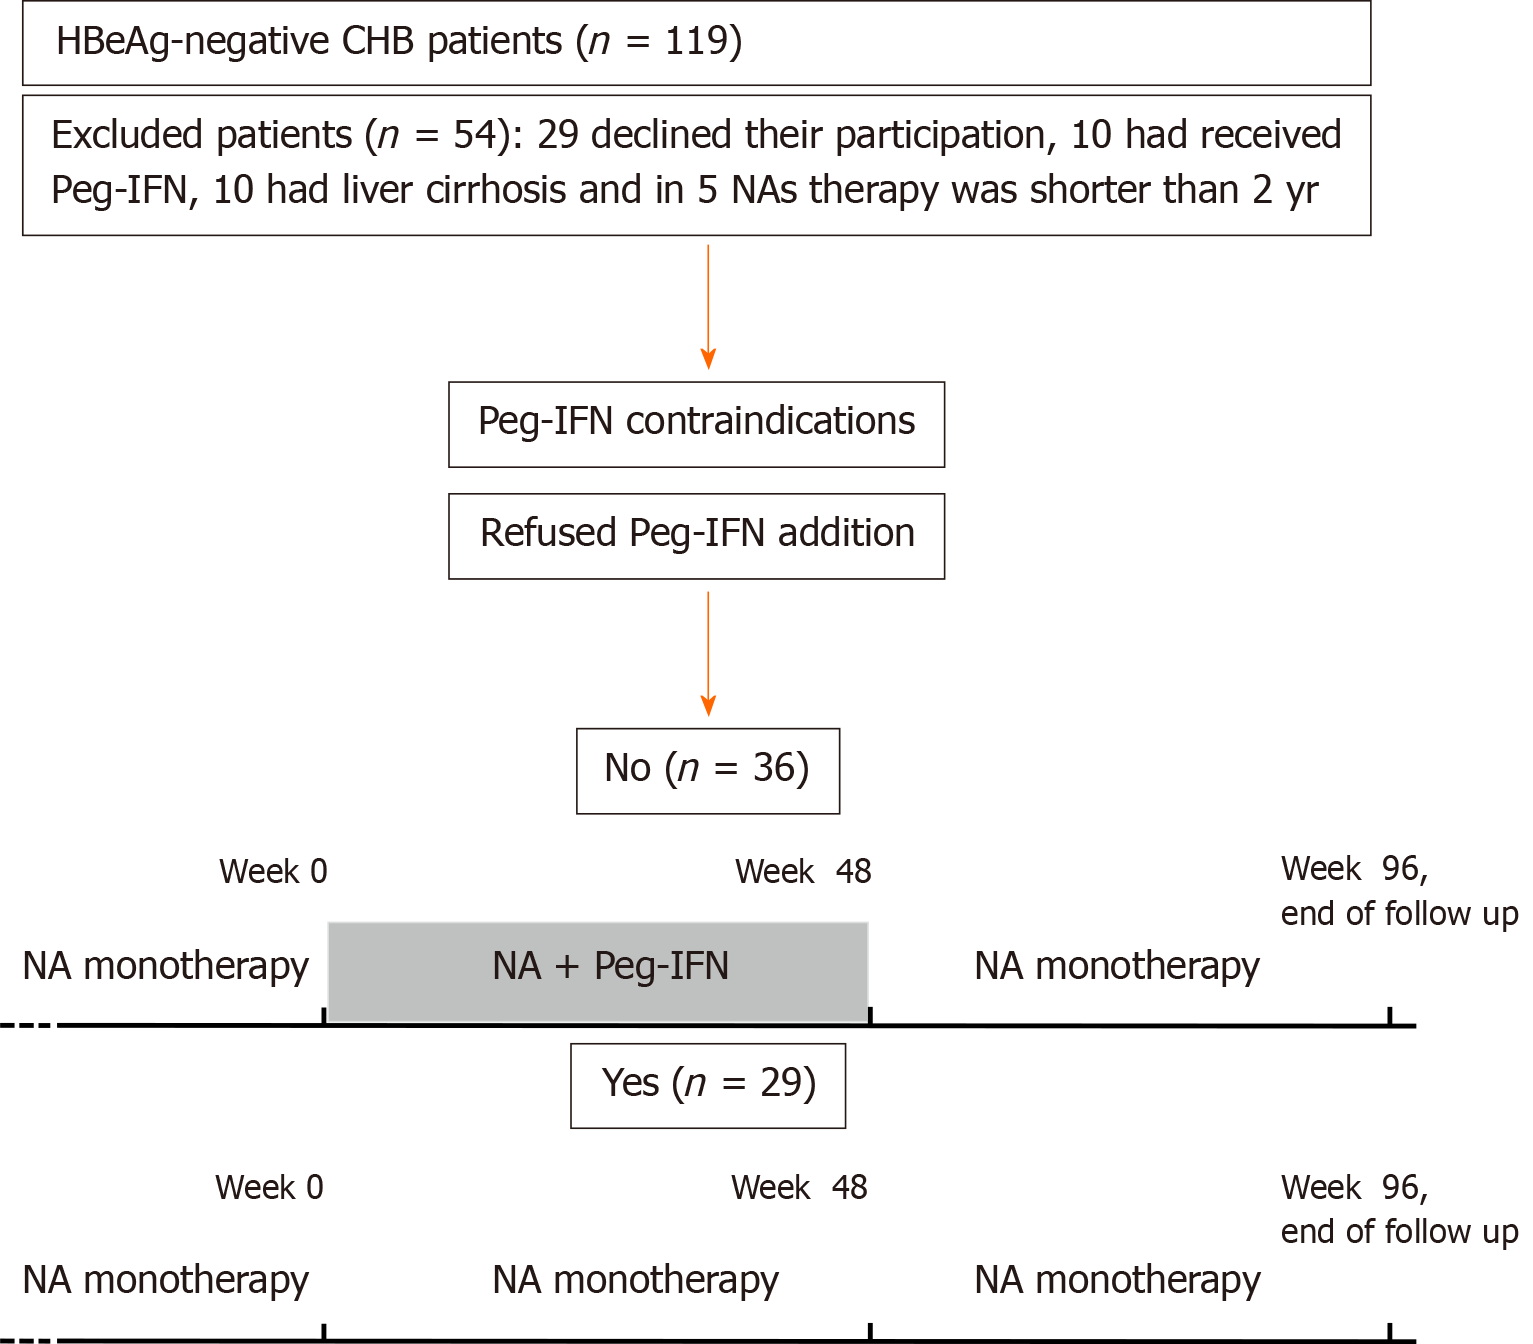
Figure 1 Flowchart of patients and study design.
HBeAg: Hepatitis B e antigen; CHB: Chronic hepatitis B; Peg-IFN: Pegylated interferon; NAs: Nucleos(t)ids analogues.
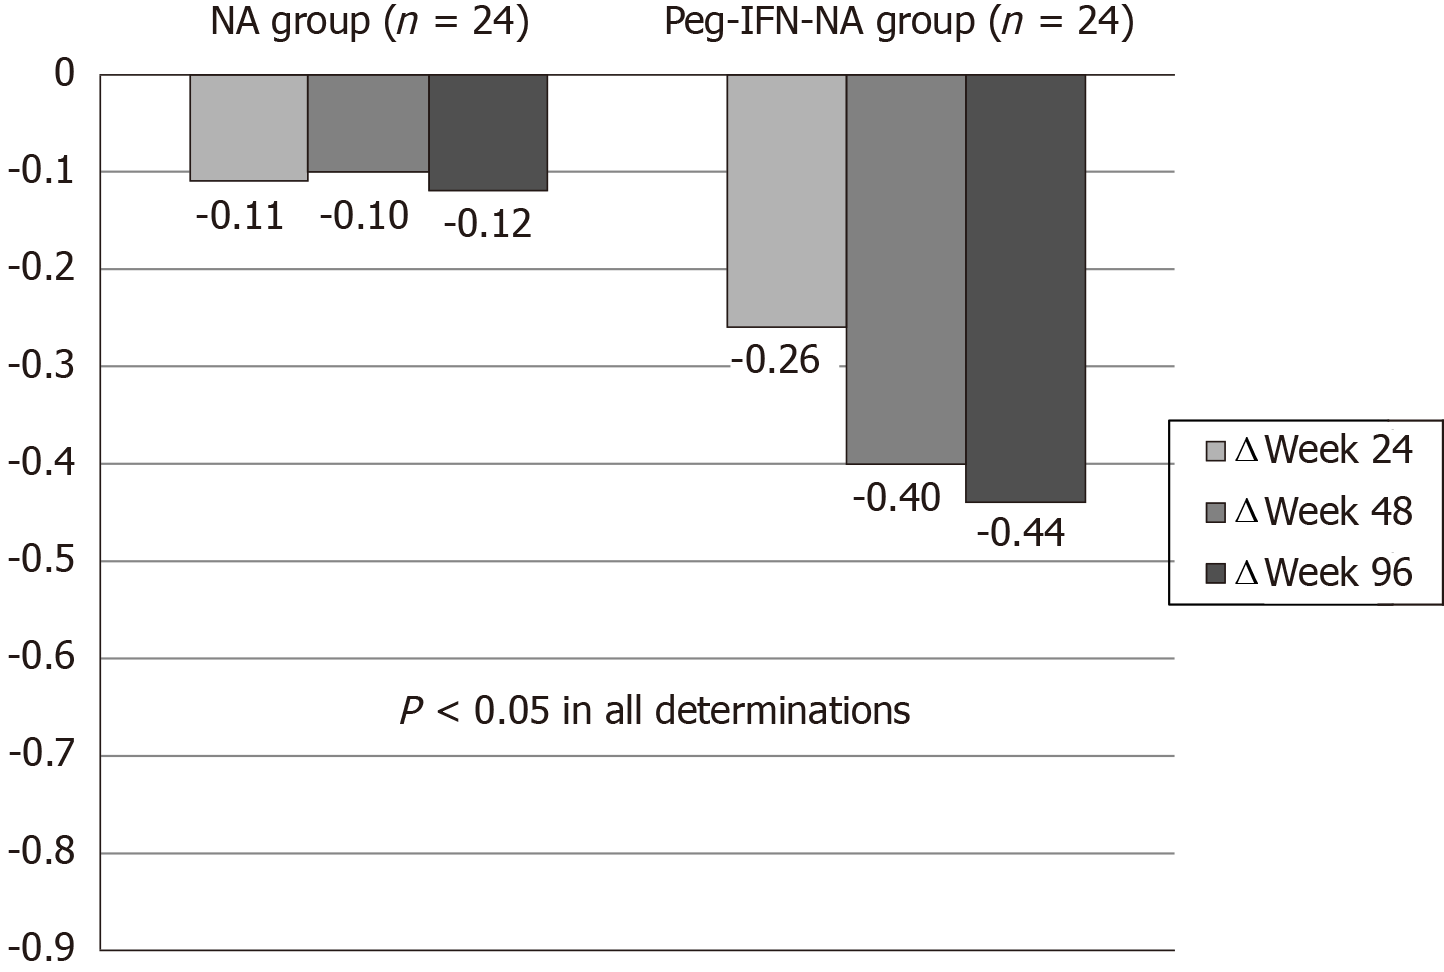
Figure 2 Hepatitis B surface antigen delta (Δ) (log10 IU/mL) at wk 24, 48 and 96 according to treatment group.
Peg-IFN: Pegylated interferon; NA: Nucleos(t)ids analogue.
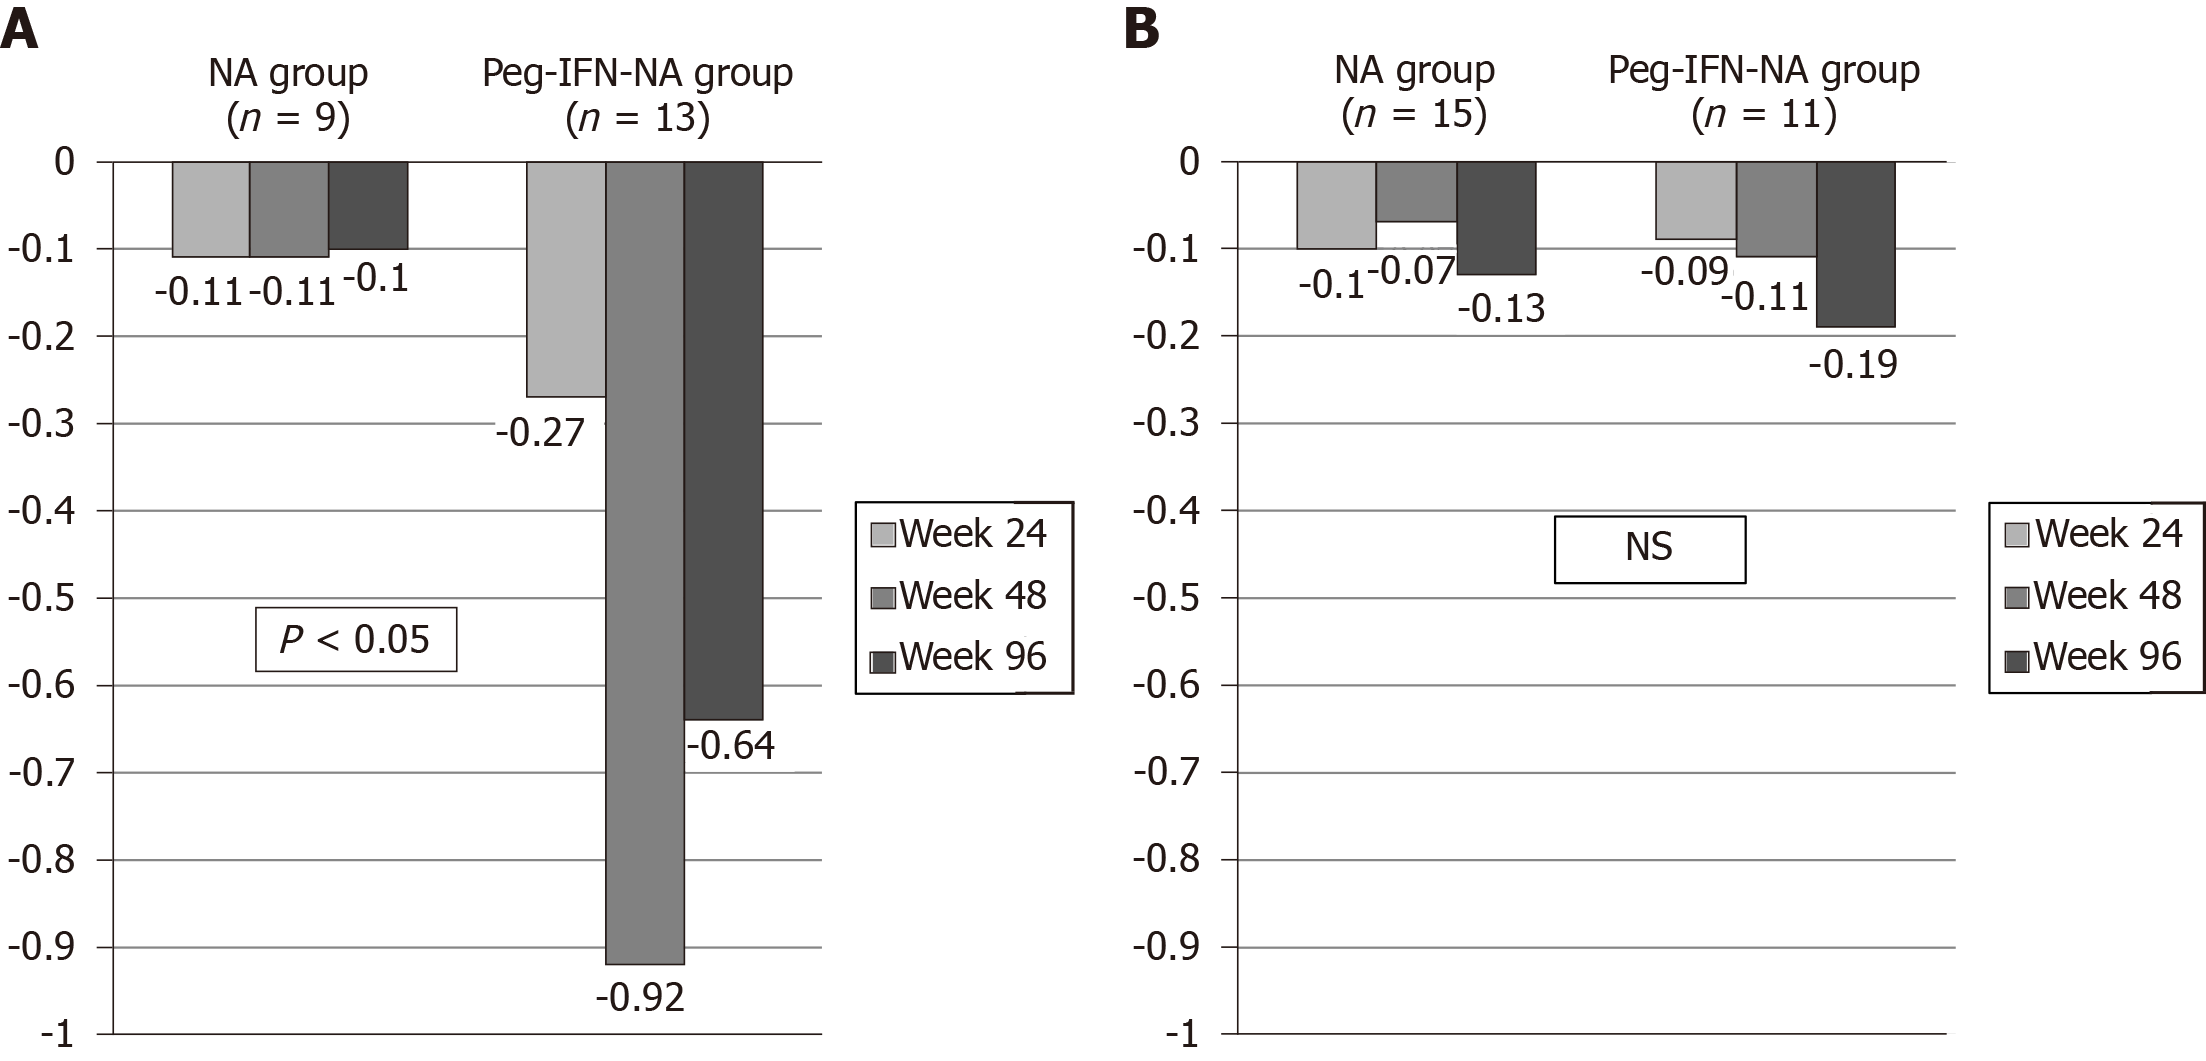
Figure 3 Hepatitis B surface antigen delta (Δ) (log10 IU/mL) according to interleukin 28B polymorphism and treatment group.
A: Hepatitis B surface antigen delta (Δ) in interleukin 28B CC patients (n = 22); B: Hepatitis B surface antigen delta (Δ) in interleukin 28B CT/TT patients (n = 26). NS: Not significant; NA: Nucleos(t)ids analogue; Peg-IFN: Pegylated interferon.
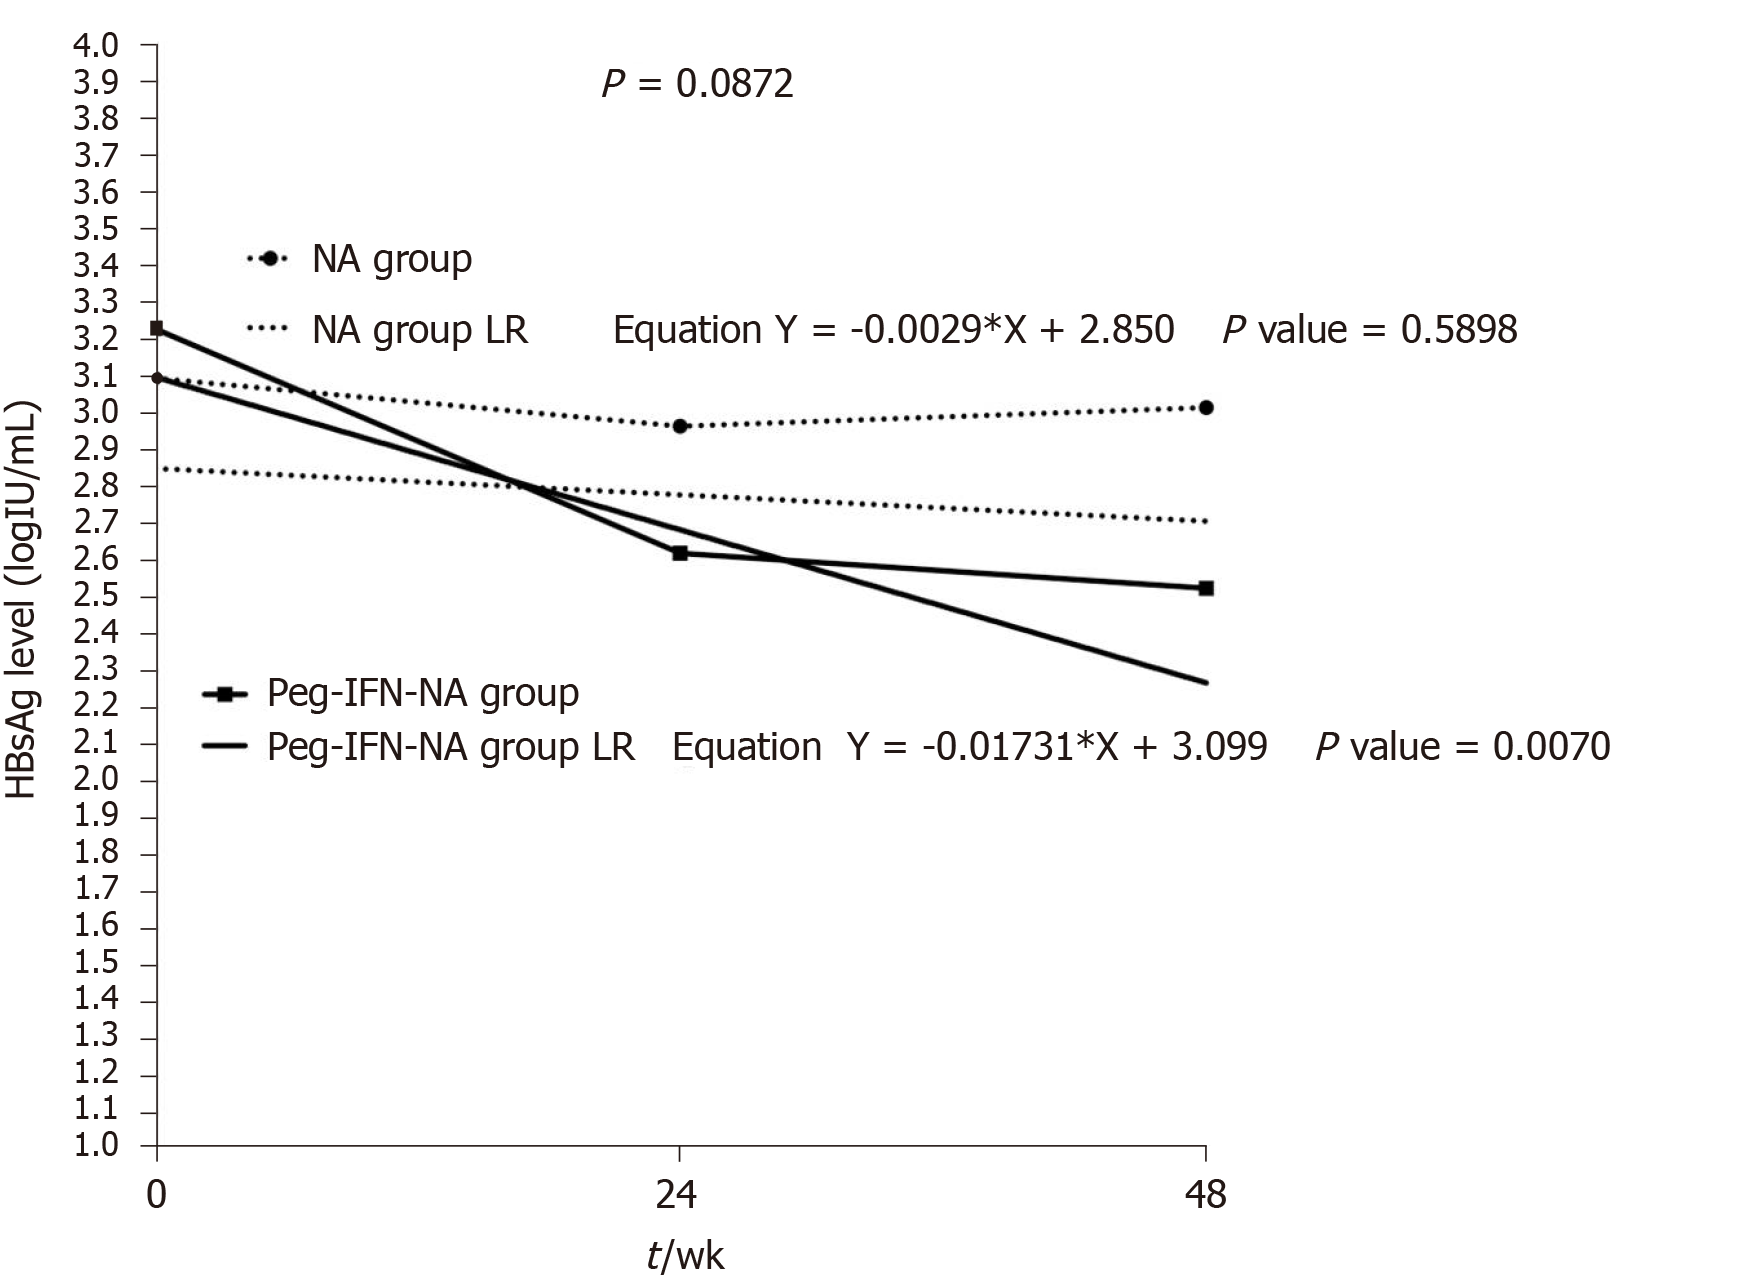
Figure 4 Linear regression model of hepatitis B surface antigen levels according to treatment group.
NA: Nucleos(t)ids analogue; Peg-IFN: Pegylated interferon; LR: Linear regression.
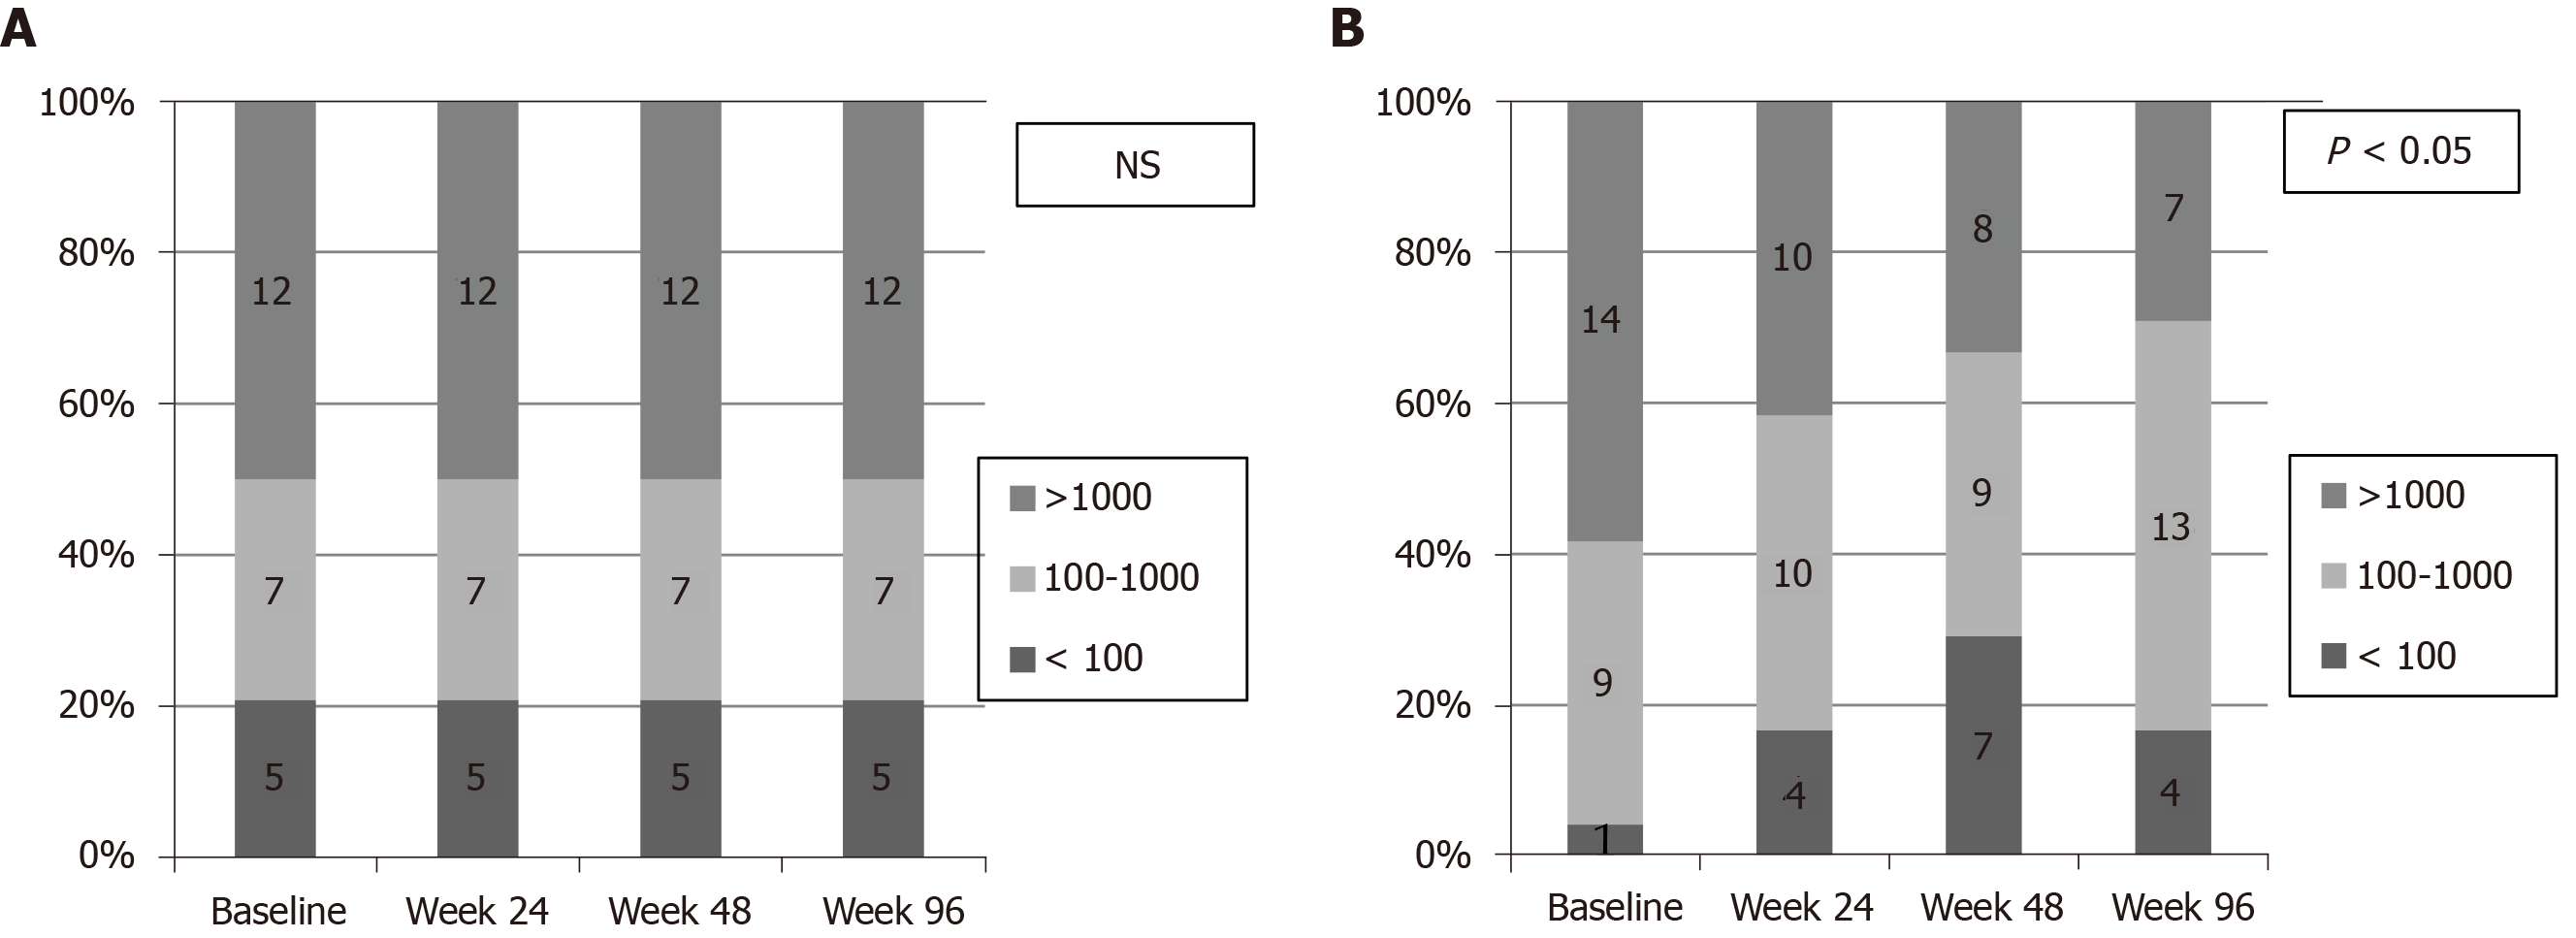
Figure 5 Rate of patients with low hepatitis B surface antigen levels (Hepatitis B surface antigen < 100 IU/mL and 100-1000 IU/mL) according to treatment group.
A: NA group; B: Peg-IFN-NA group. NS: Not significant; NA: Nucleos(t)ids analogue; Peg-IFN: Pegylated interferon.
- Citation: Broquetas T, Garcia-Retortillo M, Micó M, Canillas L, Puigvehí M, Cañete N, Coll S, Viu A, Hernandez JJ, Bessa X, Carrión JA. Hepatitis B surface antigen and hepatitis B core-related antigen kinetics after adding pegylated-interferon to nucleos(t)ids analogues in hepatitis B e antigen-negative patients. World J Hepatol 2020; 12(11): 1076-1088
- URL: https://www.wjgnet.com/1948-5182/full/v12/i11/1076.htm
- DOI: https://dx.doi.org/10.4254/wjh.v12.i11.1076


