Copyright
©The Author(s) 2017.
World J Stem Cells. Jul 26, 2017; 9(7): 98-106
Published online Jul 26, 2017. doi: 10.4252/wjsc.v9.i7.98
Published online Jul 26, 2017. doi: 10.4252/wjsc.v9.i7.98
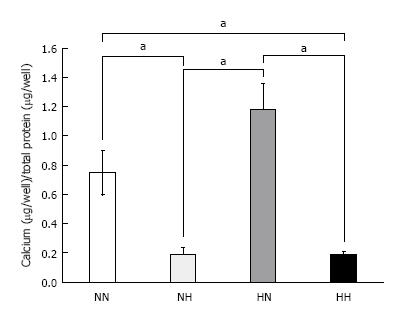
Figure 3 Calcium deposition.
Cells were exposed to normoxia (21% O2) for 14 d (NN), normoxia for 7 d followed by hypoxia (5% O2) for 7 d (NH), hypoxia for 7 d followed by normoxia for 7 d (HN), or hypoxia for 14 d (HH). Calcium deposition was adjusted to total protein content. Cells in the HN group showed the highest amount of calcium deposition among the four groups. aP < 0.05.
- Citation: Inagaki Y, Akahane M, Shimizu T, Inoue K, Egawa T, Kira T, Ogawa M, Kawate K, Tanaka Y. Modifying oxygen tension affects bone marrow stromal cell osteogenesis for regenerative medicine. World J Stem Cells 2017; 9(7): 98-106
- URL: https://www.wjgnet.com/1948-0210/full/v9/i7/98.htm
- DOI: https://dx.doi.org/10.4252/wjsc.v9.i7.98


