Copyright
©The Author(s) 2017.
World J Stem Cells. Oct 26, 2017; 9(10): 179-186
Published online Oct 26, 2017. doi: 10.4252/wjsc.v9.i10.179
Published online Oct 26, 2017. doi: 10.4252/wjsc.v9.i10.179
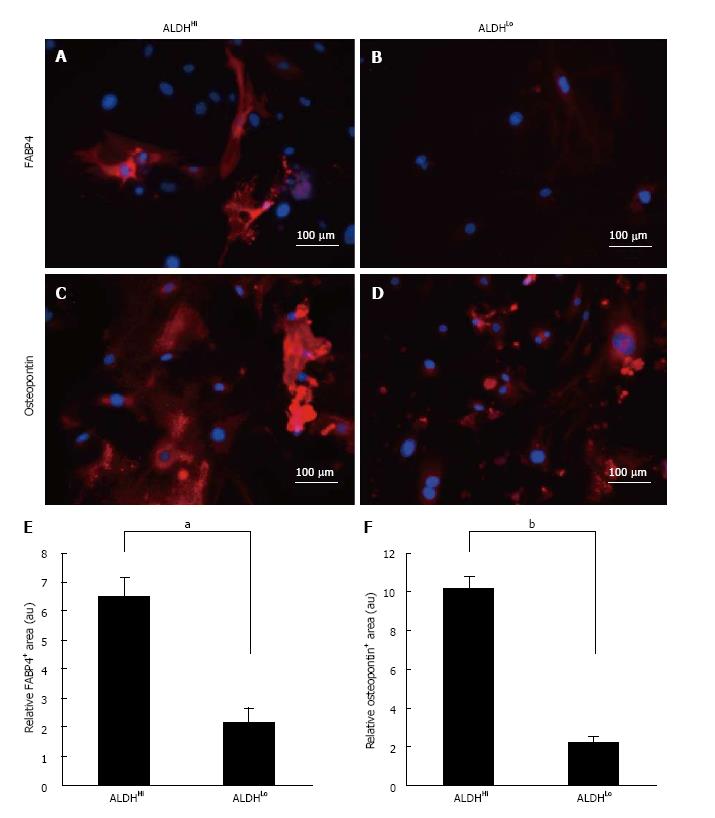
Figure 2 Marker analysis of differentiation potentials.
Differentiation potential of ALDHHi (A, C) and ALDHLo (B, D) subpopulations of ADSCs. FABP4 (A, B) and osteopontin (C, D) expression in ADSCs (red) following adipogenic (A, B) and osteogenic (C, D) differentiation of ALDHHi and ALDHLo subpopulations, as determined by immunocytochemistry. The nuclei were stained with Hoechst 33342 (blue). Quantitative analysis of differentiation-marker-positive areas in differentiated ADSCs. FABP4-positive (E) and osteopontin-positive (F) area ratios relative to respective areas of nuclear staining for ALDHHi and ALDHLo subpopulations of ADSCs after adipogenic (E) and osteogenic (F) induction. Values have been expressed in terms of mean ± SE (n = 5). aP < 0.05, bP < 0.0001, au: Arbitrary unit. ALDH: Aldehyde dehydrogenase; ADSCs: Adipose-derived stem cells; FABP: Fatty acid binding protein.
- Citation: Itoh H, Nishikawa S, Haraguchi T, Arikawa Y, Eto S, Hiyama M, Iseri T, Itoh Y, Nakaichi M, Sakai Y, Tani K, Taura Y, Itamoto K. Aldehyde dehydrogenase activity helps identify a subpopulation of murine adipose-derived stem cells with enhanced adipogenic and osteogenic differentiation potential. World J Stem Cells 2017; 9(10): 179-186
- URL: https://www.wjgnet.com/1948-0210/full/v9/i10/179.htm
- DOI: https://dx.doi.org/10.4252/wjsc.v9.i10.179


