Copyright
©The Author(s) 2016.
World J Stem Cells. Oct 26, 2016; 8(10): 342-354
Published online Oct 26, 2016. doi: 10.4252/wjsc.v8.i10.342
Published online Oct 26, 2016. doi: 10.4252/wjsc.v8.i10.342
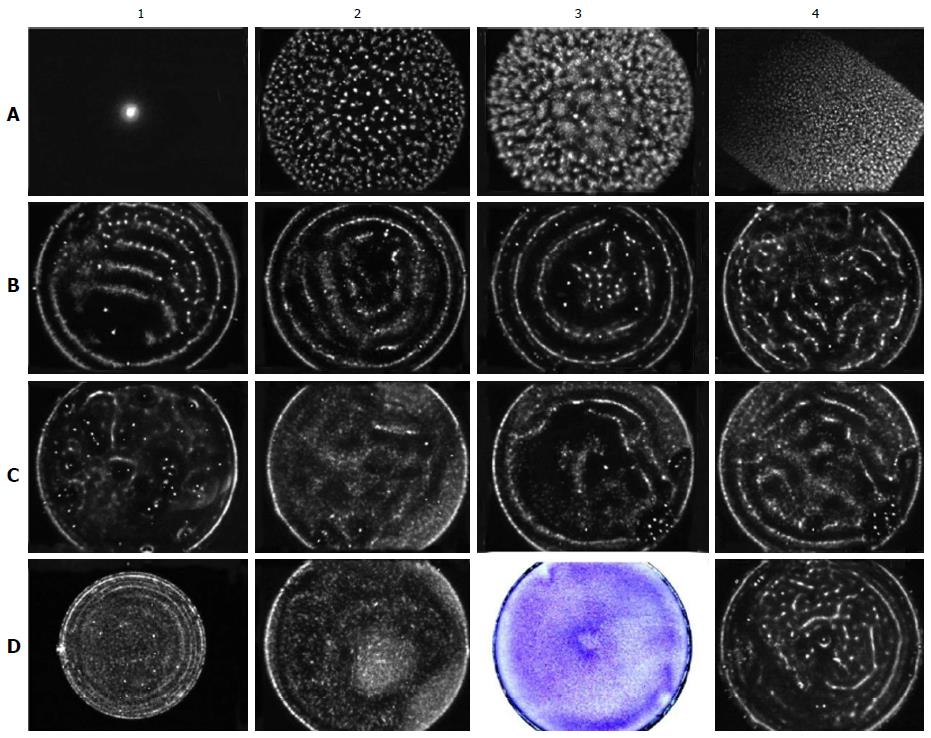
Figure 8 Evaluation of the structure of the electromagnetic field in the dishes using the gas discharge visualisation method.
Except where otherwise stated, the experimental conditions are as follows: A 50-mm culture dish with a negatively charged bottom, the grounding electrode in the centre of the dish, a voltage of 115 V, an exposure time of 20 s, and a liquid volume of 3 mL. GDG from an empty dish (A1). Water GDG (A2). GDG from a dish with a hydrophobic, uncharged bottom filled with PBS (A3). GDG from a square culture cuvette filled with PBS (A4). GDG from the dish filled with PBS when the grounding electrode is in the centre (B1, note the gap in the lower left quadrant due to the uneven distribution of the charge on the bottom of the dish), equidistant from the centre and the edge (B2), and at the side (B3) of the dish. GDG from the complete culture medium α-MEM (B4). GDG from α-MEM incubated in the dish at 37 °C for one day (C1). GDG from the dish containing NCTCs at 25 × 103 cells/cm2, at a voltage of 90 V (C2) and at a voltage of 115 V, with exposure for 10 (C3) and 20 s (C4). GDG from a 35-mm culture dish with NCTCs at 25 × 103 cells/cm2, at a voltage of 125 V (D1). GDG from rBMSCs incubated with the magnetised needle for one day (D2). The same cells after fixation and staining (D3). GDG from E. coli at 200 × 103 cells/mL. rBMSCs: Rat bone marrow-derived stromal stem cells; GDG: Gas discharge glow; E. coli: Escherichia coli.
- Citation: Emelyanov AN, Borisova MV, Kiryanova VV. Model acupuncture point: Bone marrow-derived stromal stem cells are moved by a weak electromagnetic field. World J Stem Cells 2016; 8(10): 342-354
- URL: https://www.wjgnet.com/1948-0210/full/v8/i10/342.htm
- DOI: https://dx.doi.org/10.4252/wjsc.v8.i10.342


