Copyright
©The Author(s) 2015.
World J Stem Cells. Jun 26, 2015; 7(5): 883-893
Published online Jun 26, 2015. doi: 10.4252/wjsc.v7.i5.883
Published online Jun 26, 2015. doi: 10.4252/wjsc.v7.i5.883
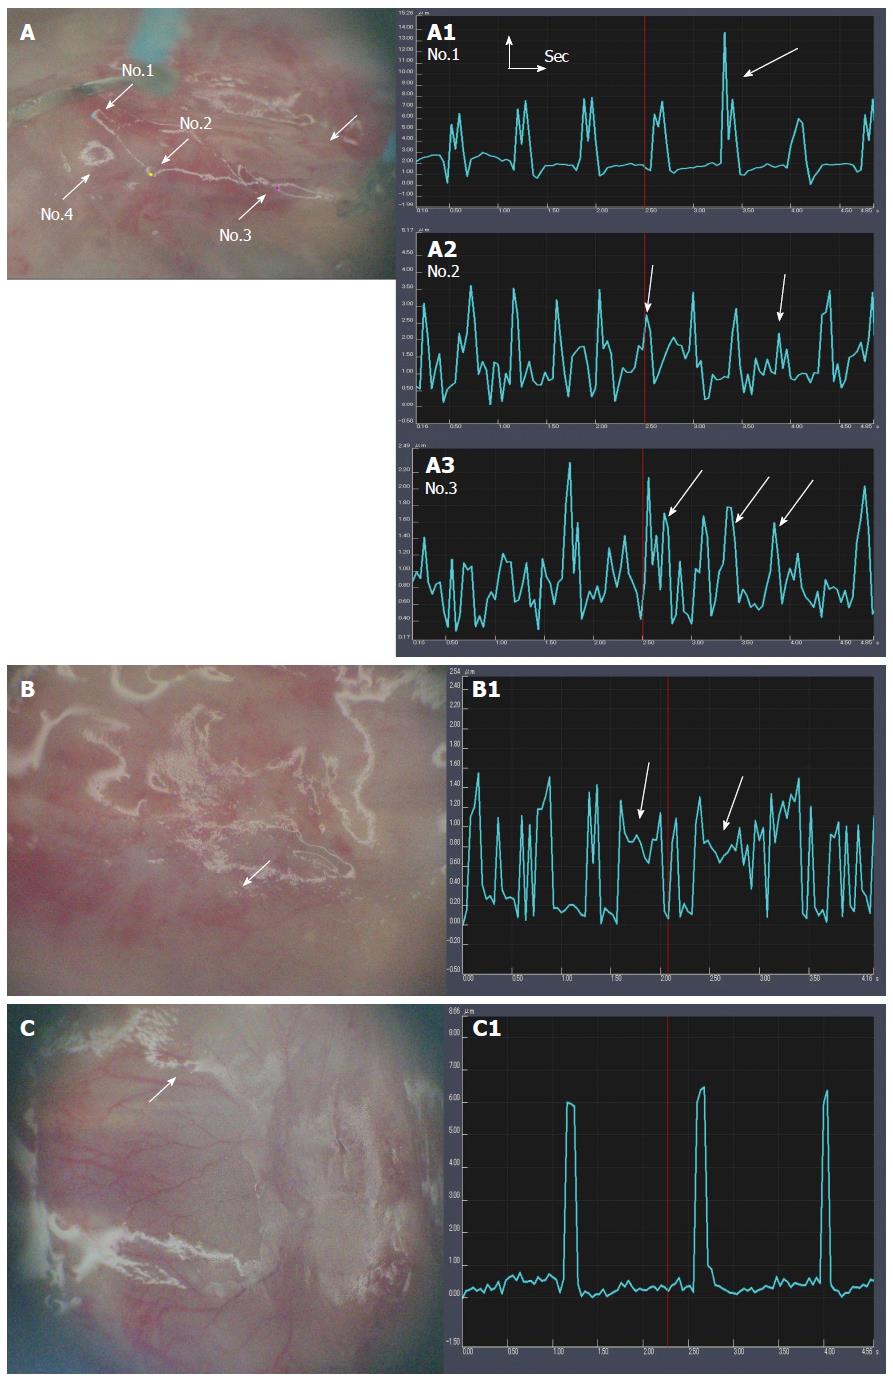
Figure 4 Motion image analysis of transplanted domains.
A: Rich motion areas (arrows) in G1 NaOH(+), HVJ-E(+), Cardiomyocytes(+). Length: μm; width: time (s); A1: The amplitudes are ordered. Large amplitudes rarely appear (arrow); A2: The amplitudes are more frequent, and their width is mostly ordered, but their amplitudes are both high and low. Low amplitudes (arrows) are fewer than high amplitudes; A3: The amplitude width is disordered. The amplitudes consist of three kinds: high, middle (arrows), and low. The frequency of each size is as follows: low > middle > high; B: Poor beating areas in G3 NaOH(-), HVJ-E(+), Cardiomyocytes(+); B1: The width between the amplitudes is irregular. High and low amplitudes are mixed. In particular, some amplitudes do not return to the baseline, and stop on the way for a short time (arrows); C: Poor motion areas in G2 NaOH(+), HVJ-E(-), Cardiomyocytes(+); C1: The amplitude width is long. The amplitudes maintain the same height. HVJ-E: Hemagglutinating virus of Japan envelope.
- Citation: Takahashi Y, Tomotsune D, Takizawa S, Yue F, Nagai M, Yokoyama T, Hirashima K, Sasaki K. New model for cardiomyocyte sheet transplantation using a virus-cell fusion technique. World J Stem Cells 2015; 7(5): 883-893
- URL: https://www.wjgnet.com/1948-0210/full/v7/i5/883.htm
- DOI: https://dx.doi.org/10.4252/wjsc.v7.i5.883


