Copyright
©The Author(s) 2015.
World J Stem Cells. Jan 26, 2015; 7(1): 37-50
Published online Jan 26, 2015. doi: 10.4252/wjsc.v7.i1.37
Published online Jan 26, 2015. doi: 10.4252/wjsc.v7.i1.37
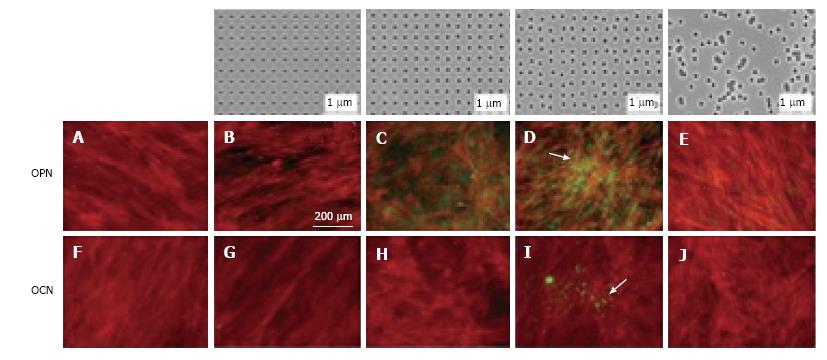
Figure 2 The effect of nanopits on the differentiation of stem cells.
The top row showed the nanotopographies produced using electron beam lithography. All have 120 nm diameter pits (100 nm deep, absolute or average 300 nm centre-centre spacing) with square (B, G), displaced square 20 (± 20 nm from true centre), (C, H), displaced square 50 (± 50 nm from true centre) (D,I) and random placements (E, J). There is lack of positive staining for osteocalcin (OCN) and osteopontin (OPN) on control nanotopographies (A, F) but good positive staining for expression for OPN and OCN for cells grown on displaced square 50 nanotopographies (D, I). Actin = red, OPN/OCN = green. Taken with permission from Dalby MJ, Gadegaard N, Tare R, Andar A, Riehle MO, Herzyk P, Wilkinson CD, Oreffo RO. The control of human mesenchymal cell differentiation using nanoscale symmetry and disorder. Nat Mater 2007; 6: 997-1003.
- Citation: Griffin MF, Butler PE, Seifalian AM, Kalaskar DM. Control of stem cell fate by engineering their micro and nanoenvironment. World J Stem Cells 2015; 7(1): 37-50
- URL: https://www.wjgnet.com/1948-0210/full/v7/i1/37.htm
- DOI: https://dx.doi.org/10.4252/wjsc.v7.i1.37


