Copyright
©2012 Baishideng.
World J Stem Cells. Apr 26, 2012; 4(4): 21-27
Published online Apr 26, 2012. doi: 10.4252/wjsc.v4.i4.21
Published online Apr 26, 2012. doi: 10.4252/wjsc.v4.i4.21
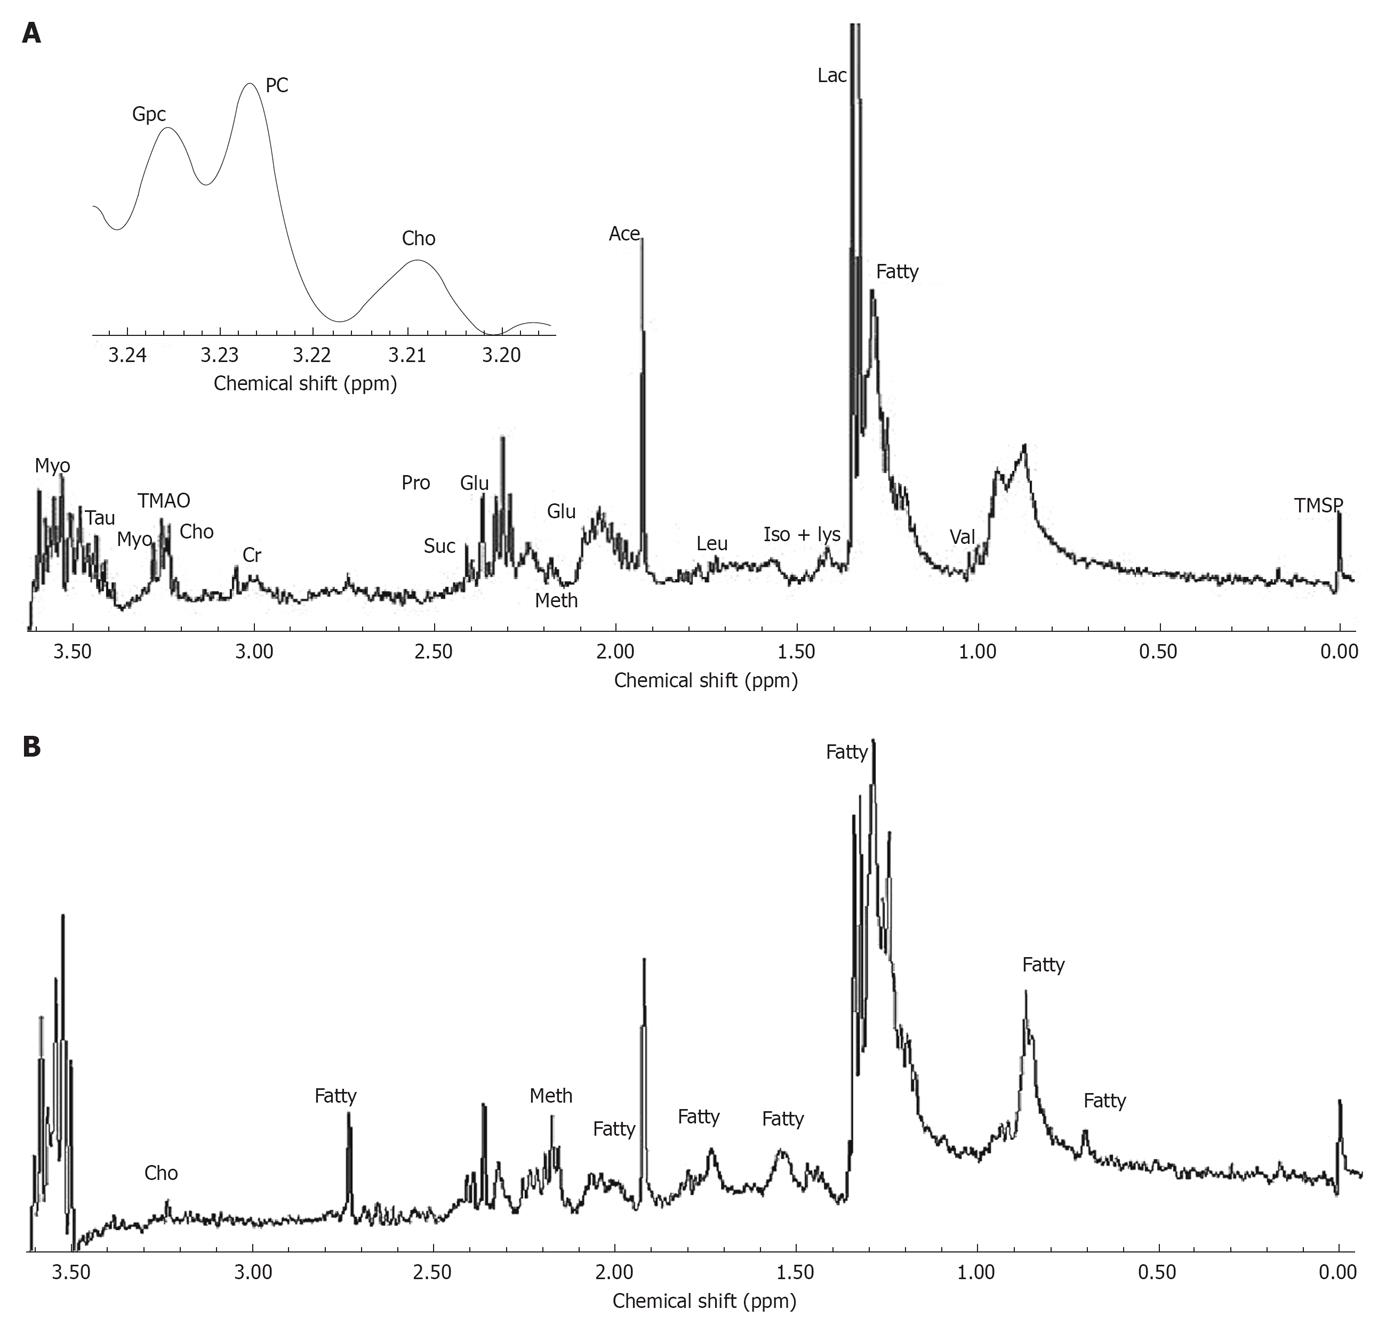
Figure 3 Metabolic profile of human umbilical mesenchymal stem cells before and after adipogenic differentiation.
A and B are the nuclear magnetic resonance Spectrums of human umbilical mesenchymal stem cells (HUMSCs) and adipogenic differentiation, respectively. The two spectrums demonstrated that the levels of intracellular metabolites, such as choline, creatine, glutamate and acetate all decreased with the increased level of methionine, succinate and fatty acids after the HUMSCs differentiation 2 wk.
- Citation: Xu ZF, Pan AZ, Yong F, Shen CY, Chen YW, Wu RH. Human umbilical mesenchymal stem cell and its adipogenic differentiation: Profiling by nuclear magnetic resonance spectroscopy. World J Stem Cells 2012; 4(4): 21-27
- URL: https://www.wjgnet.com/1948-0210/full/v4/i4/21.htm
- DOI: https://dx.doi.org/10.4252/wjsc.v4.i4.21


