Copyright
©2012 Baishideng.
World J Stem Cells. Oct 26, 2012; 4(10): 101-109
Published online Oct 26, 2012. doi: 10.4252/wjsc.v4.i10.101
Published online Oct 26, 2012. doi: 10.4252/wjsc.v4.i10.101
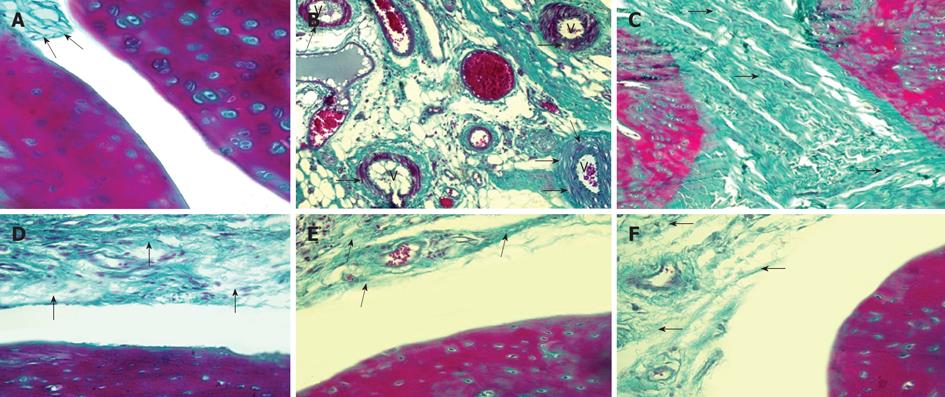
Figure 4 Photomicrograph of rat from negative control group (A), positive control group (B), positive control group (C), methotrexate group (D), CD34 group (E) and mesenchymal group (F).
A: Negative control group showed synovial tissue with delicate collagen fibers (arrows) (Masson’s trichrome, × 400); B: Positive control (PC) group showed vascular edema and vacuoles (arrows) within vessels (V) of the synovial tissue (Masson’s trichrome × 200); C: PC group showed extensive fibrosis (arrows) completely obliterating the joint cavity (Masson’s trichrome, × 200); D: Methotrexate group showed moderate increase in collagen fibers (arrows) of the synovial tissue (Masson’s trichrome, × 200); E: CD34 group showed mild increase in collagen fibers (arrows) of the synovial tissue (Masson’s trichrome, × 200); F: Mesenchymal group showed mild increase in collagen fibers (arrows) of the synovial tissue (Masson’s trichrome, × 200).
- Citation: Greish S, Abogresha N, Abdel-Hady Z, Zakaria E, Ghaly M, Hefny M. Human umbilical cord mesenchymal stem cells as treatment of adjuvant rheumatoid arthritis in a rat model. World J Stem Cells 2012; 4(10): 101-109
- URL: https://www.wjgnet.com/1948-0210/full/v4/i10/101.htm
- DOI: https://dx.doi.org/10.4252/wjsc.v4.i10.101


