Copyright
©2011 Baishideng Publishing Group Co.
World J Stem Cells. Dec 26, 2011; 3(12): 113-121
Published online Dec 26, 2011. doi: 10.4252/wjsc.v3.i12.113
Published online Dec 26, 2011. doi: 10.4252/wjsc.v3.i12.113
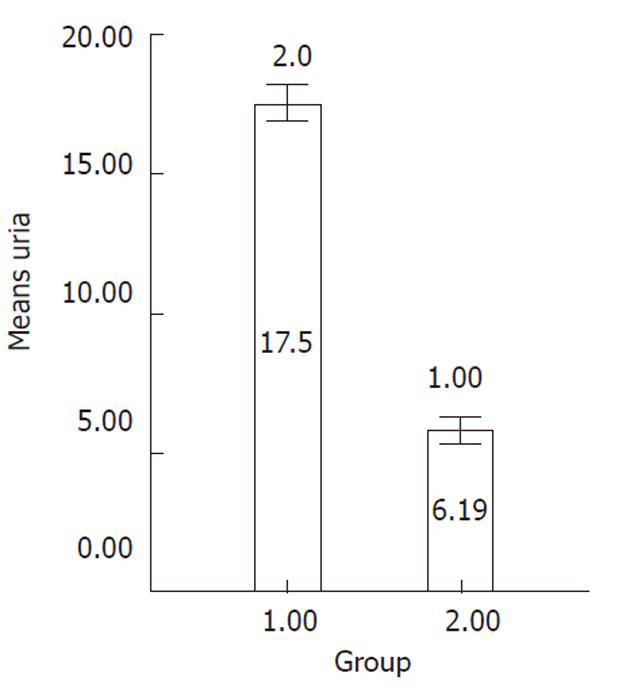
Figure 7 Production of urea in hepatogenic differentiated cells (group-1) compared to undifferentiated cells (group-2).
The urea production as mg/dL (Y-axis) was significantly increased over culture time (P < 0.001).
- Citation: Ayatollahi M, Soleimani M, Tabei SZ, Kabir Salmani M. Hepatogenic differentiation of mesenchymal stem cells induced by insulin like growth factor-I. World J Stem Cells 2011; 3(12): 113-121
- URL: https://www.wjgnet.com/1948-0210/full/v3/i12/113.htm
- DOI: https://dx.doi.org/10.4252/wjsc.v3.i12.113


