Copyright
©2010 Baishideng Publishing Group Co.
World J Stem Cells. Dec 26, 2010; 2(6): 127-140
Published online Dec 26, 2010. doi: 10.4252/wjsc.v2.i6.127
Published online Dec 26, 2010. doi: 10.4252/wjsc.v2.i6.127
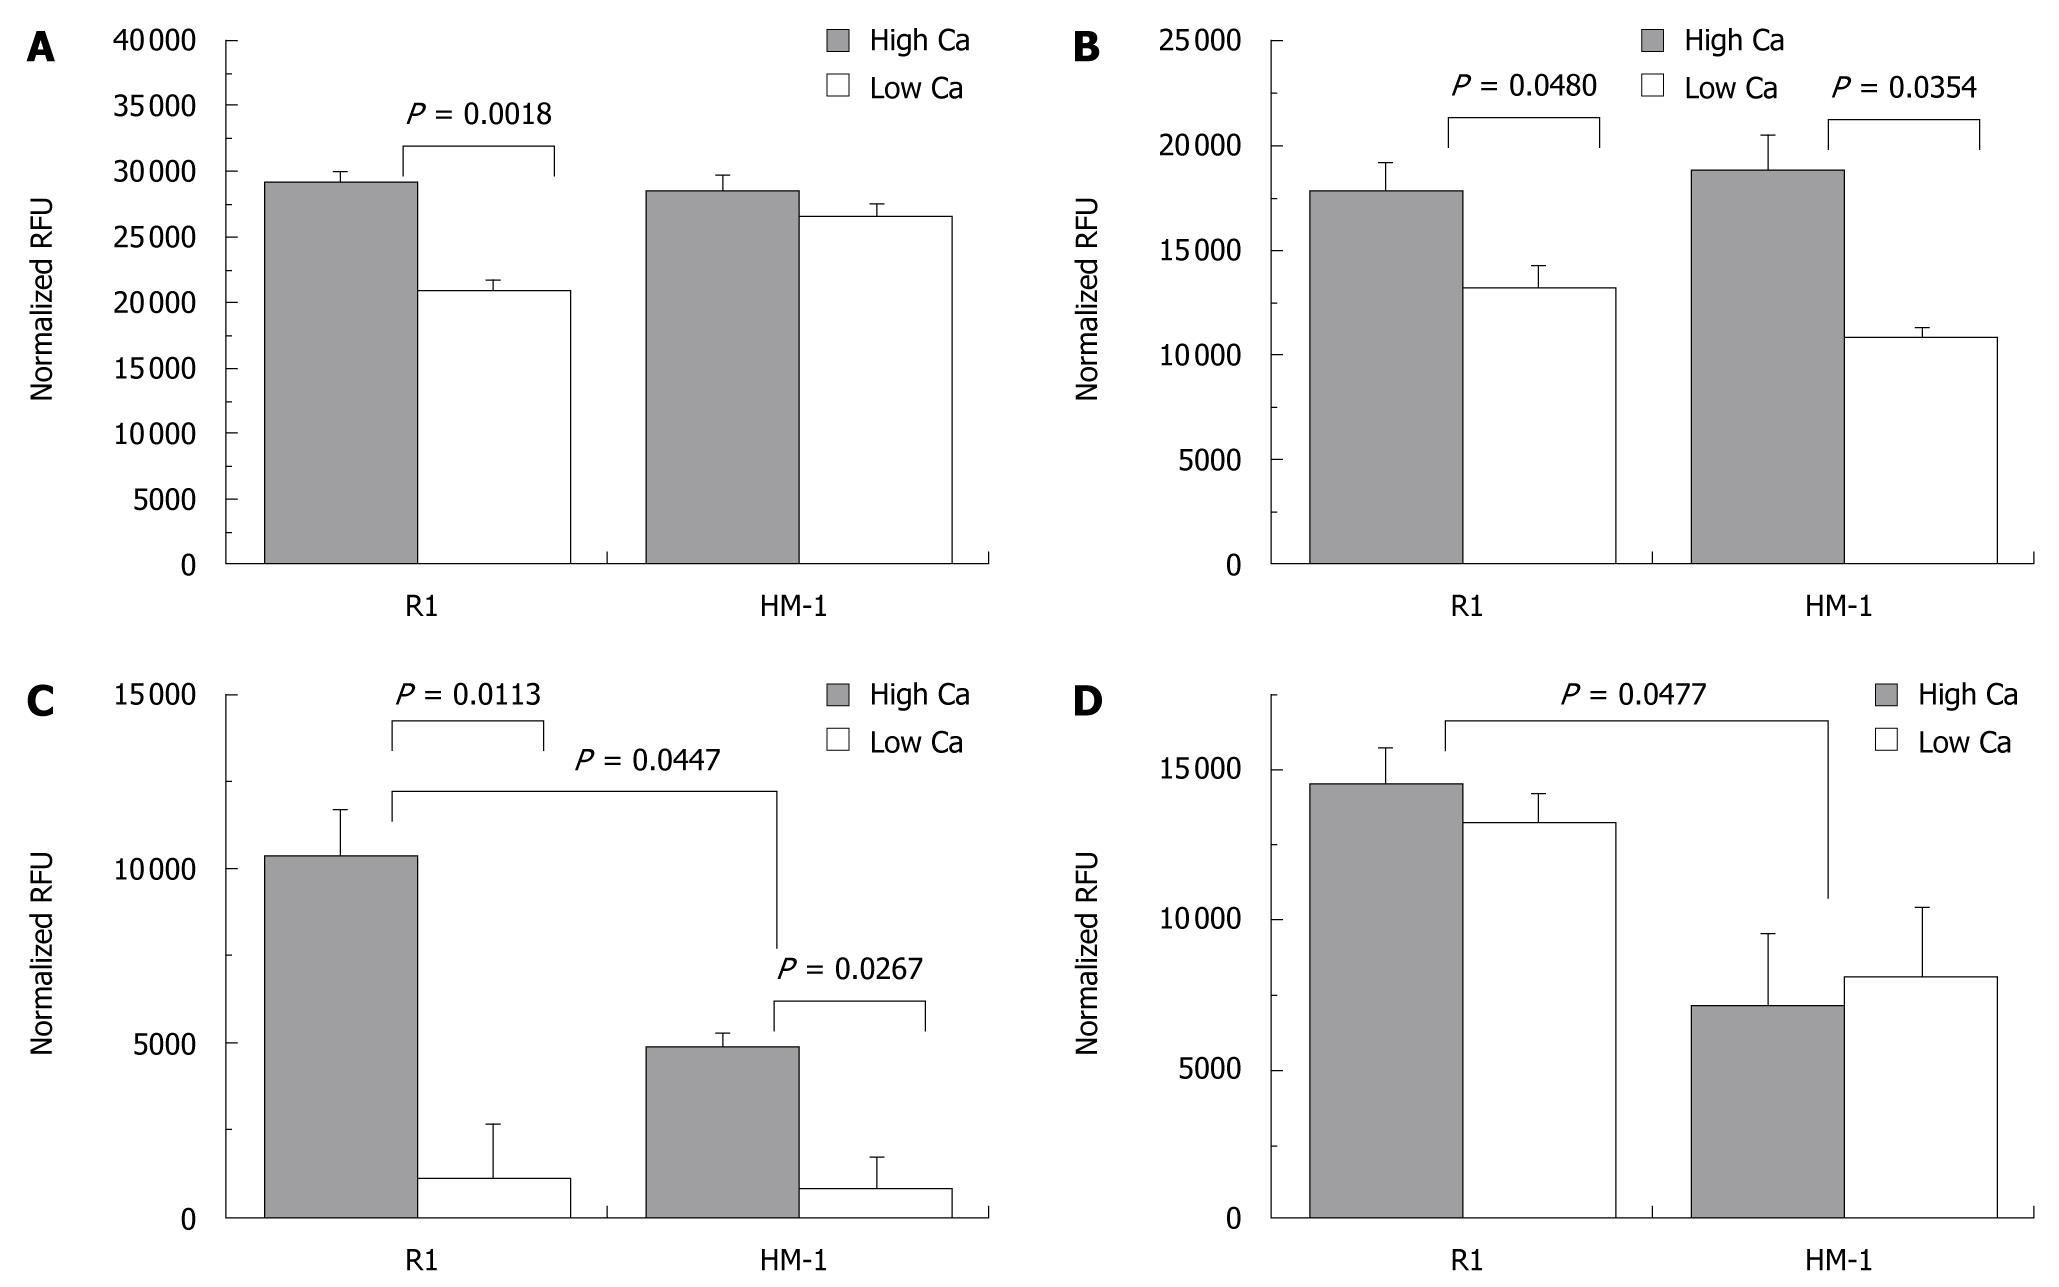
Figure 4 Comparison of agonist-induced changes of [Ca2+]i in high- and low-Ca solutions.
Cell fluorescence was monitored before and after addition of agents in high-Ca (1.8 mmol/L) and low-Ca (0.6 mmol/L) Hank’s medium. Panels summarize effects of (A) 200 mmol/L ATP (B), 20 mmol/L Bradykinin (C), 100 mmol/L Histamine (D) 20 mmol/L Thapsigargin. Asterisks mark significant (P < 0.05) differences.
- Citation: Mamo S, Kobolak J, Borbíró I, Bíró T, Bock I, Dinnyes A. Gene targeting and Calcium handling efficiencies in mouse embryonic stem cell lines. World J Stem Cells 2010; 2(6): 127-140
- URL: https://www.wjgnet.com/1948-0210/full/v2/i6/127.htm
- DOI: https://dx.doi.org/10.4252/wjsc.v2.i6.127


