Copyright
©The Author(s) 2025.
World J Stem Cells. Apr 26, 2025; 17(4): 103314
Published online Apr 26, 2025. doi: 10.4252/wjsc.v17.i4.103314
Published online Apr 26, 2025. doi: 10.4252/wjsc.v17.i4.103314
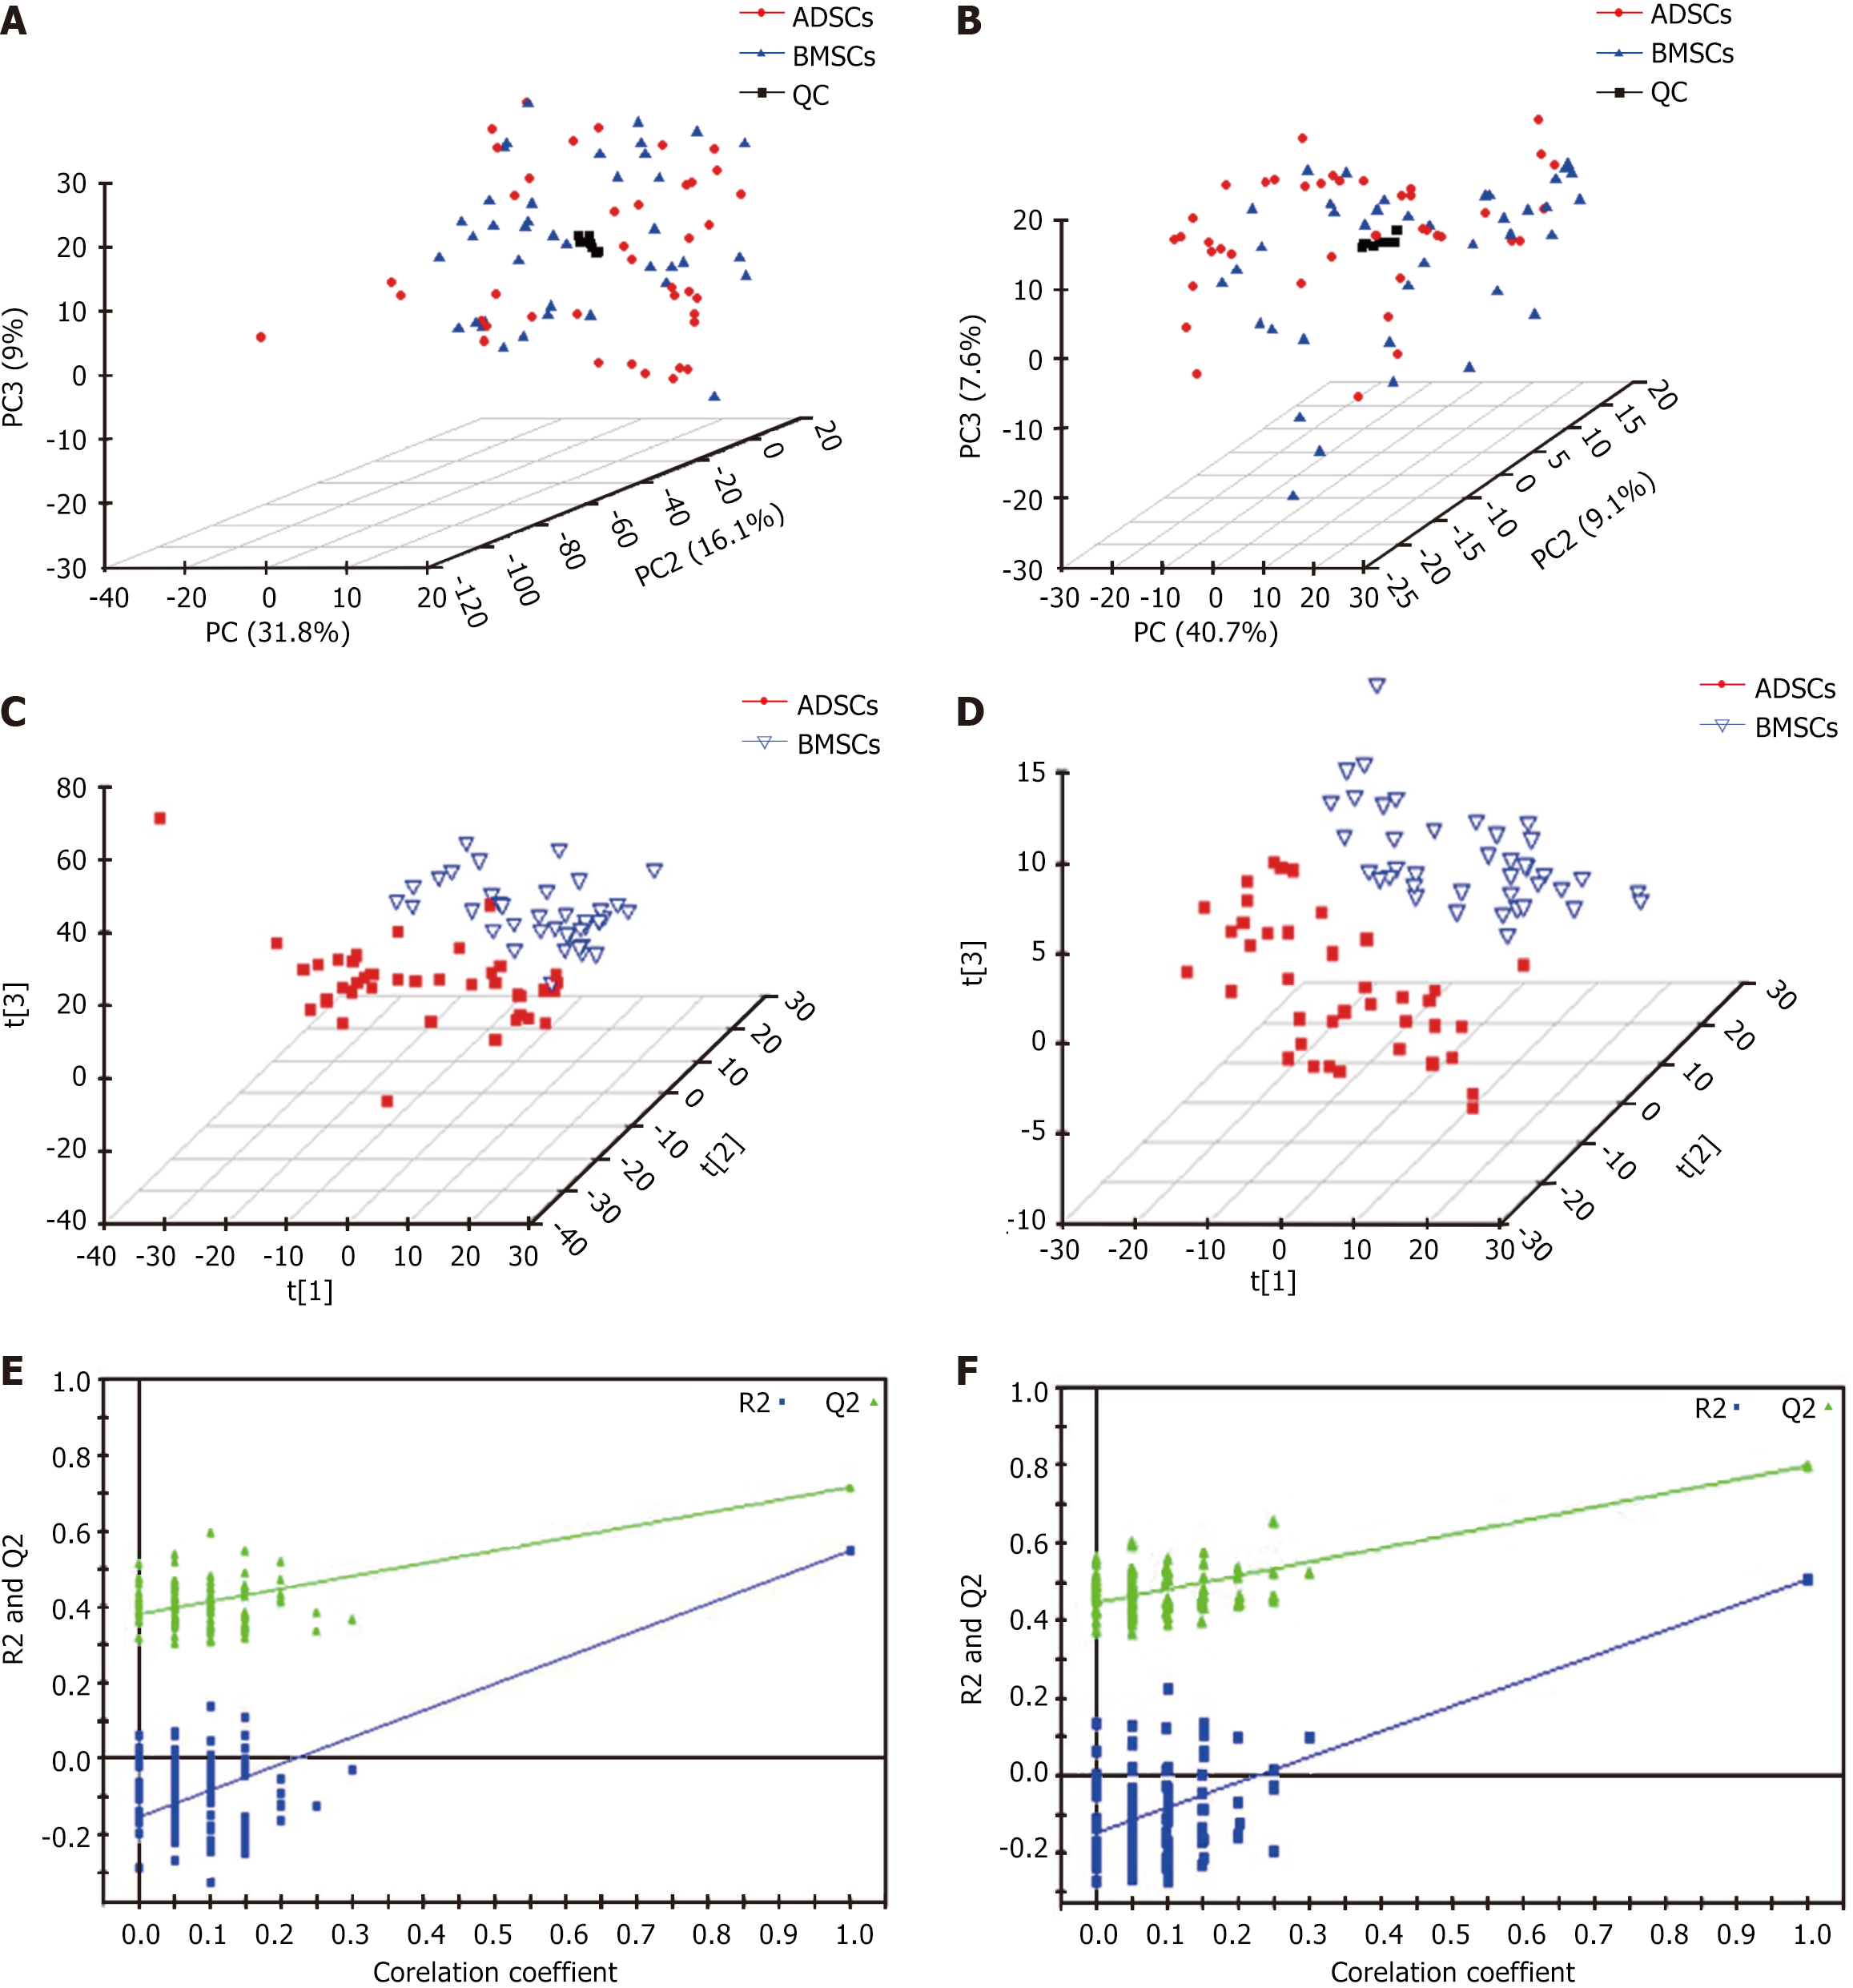
Figure 1 Principal component analysis and partial least squares discriminant analysis score three-dimensional score plots and validation plots for discriminating bone marrow-derived mesenchymal stem cells and adipose tissue-derived mesenchymal stem cells in electron spray ionization in the positive and negative modes.
A: Principal component analysis plot in electron spray ionization (ESI)+ mode; B: Principal component analysis plot in ESI- mode; C: Partial least squares discriminant analysis score plot in ESI+ mode; D: Partial least squares discriminant analysis score plot in ESI- mode; E: Validation plot in ESI+ mode; F: Validation plot in ESI- mode. QC: Quality control; ADSCs: Adipose tissue-derived mesenchymal stem cells; BMSCs: Bone marrow-derived mesenchymal stem cells.
- Citation: Li JZ, Zhan X, Sun HB, Chi C, Zhang GF, Liu DH, Zhang WX, Sun LH, Kang K. L-arginine from elder human mesenchymal stem cells induces angiogenesis and enhances therapeutic effects on ischemic heart diseases. World J Stem Cells 2025; 17(4): 103314
- URL: https://www.wjgnet.com/1948-0210/full/v17/i4/103314.htm
- DOI: https://dx.doi.org/10.4252/wjsc.v17.i4.103314


