Copyright
©The Author(s) 2025.
World J Stem Cells. Apr 26, 2025; 17(4): 101290
Published online Apr 26, 2025. doi: 10.4252/wjsc.v17.i4.101290
Published online Apr 26, 2025. doi: 10.4252/wjsc.v17.i4.101290
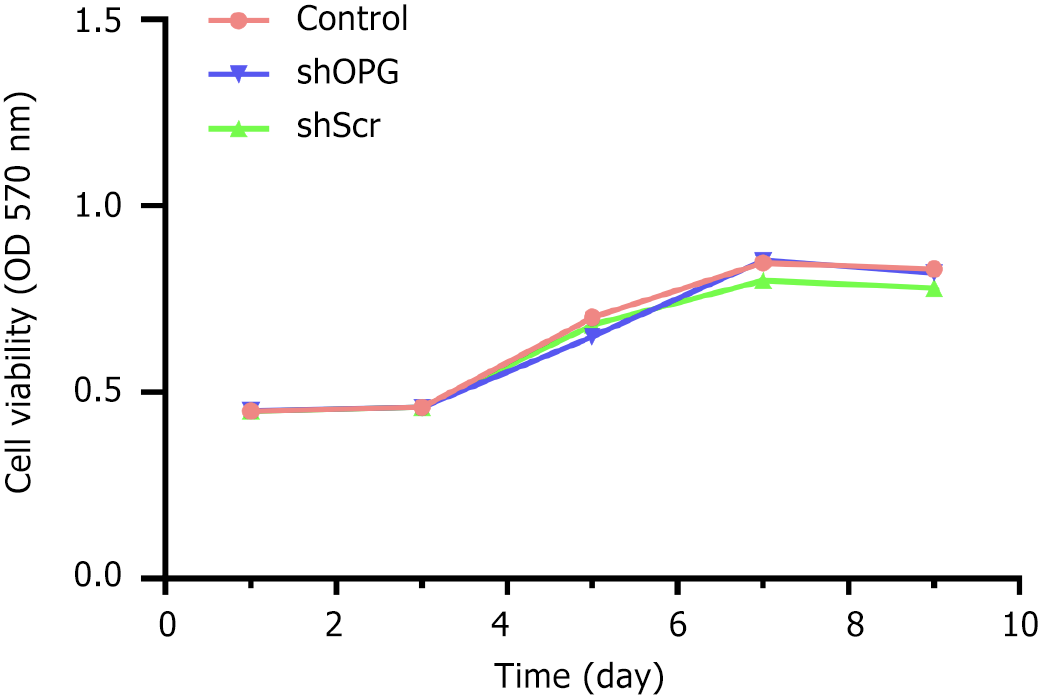
Figure 2 MTT assay to detect changes in cell proliferation in each group.
The cell proliferation growth curves for each group were plotted with time on the X-axis and absorbance (A value) on the Y-axis. The experimental group, “shOPG”, represents osteoprotegerin gene-silenced bone marrow-derived mesenchymal stem cells (BMSCs) transfected with shOPG. The control group, “shScr”, consists of BMSCs transfected with a scrambling vector, while the “control” group includes untreated BMSCs.
- Citation: Wei SG, Chen HH, Xie LR, Qin Y, Mai YY, Huang LH, Liao HB. RNA interference-mediated osteoprotegerin silencing increases the receptor activator of nuclear factor-kappa B ligand/osteoprotegerin ratio and promotes osteoclastogenesis. World J Stem Cells 2025; 17(4): 101290
- URL: https://www.wjgnet.com/1948-0210/full/v17/i4/101290.htm
- DOI: https://dx.doi.org/10.4252/wjsc.v17.i4.101290


