Copyright
©The Author(s) 2025.
World J Stem Cells. Mar 26, 2025; 17(3): 99472
Published online Mar 26, 2025. doi: 10.4252/wjsc.v17.i3.99472
Published online Mar 26, 2025. doi: 10.4252/wjsc.v17.i3.99472
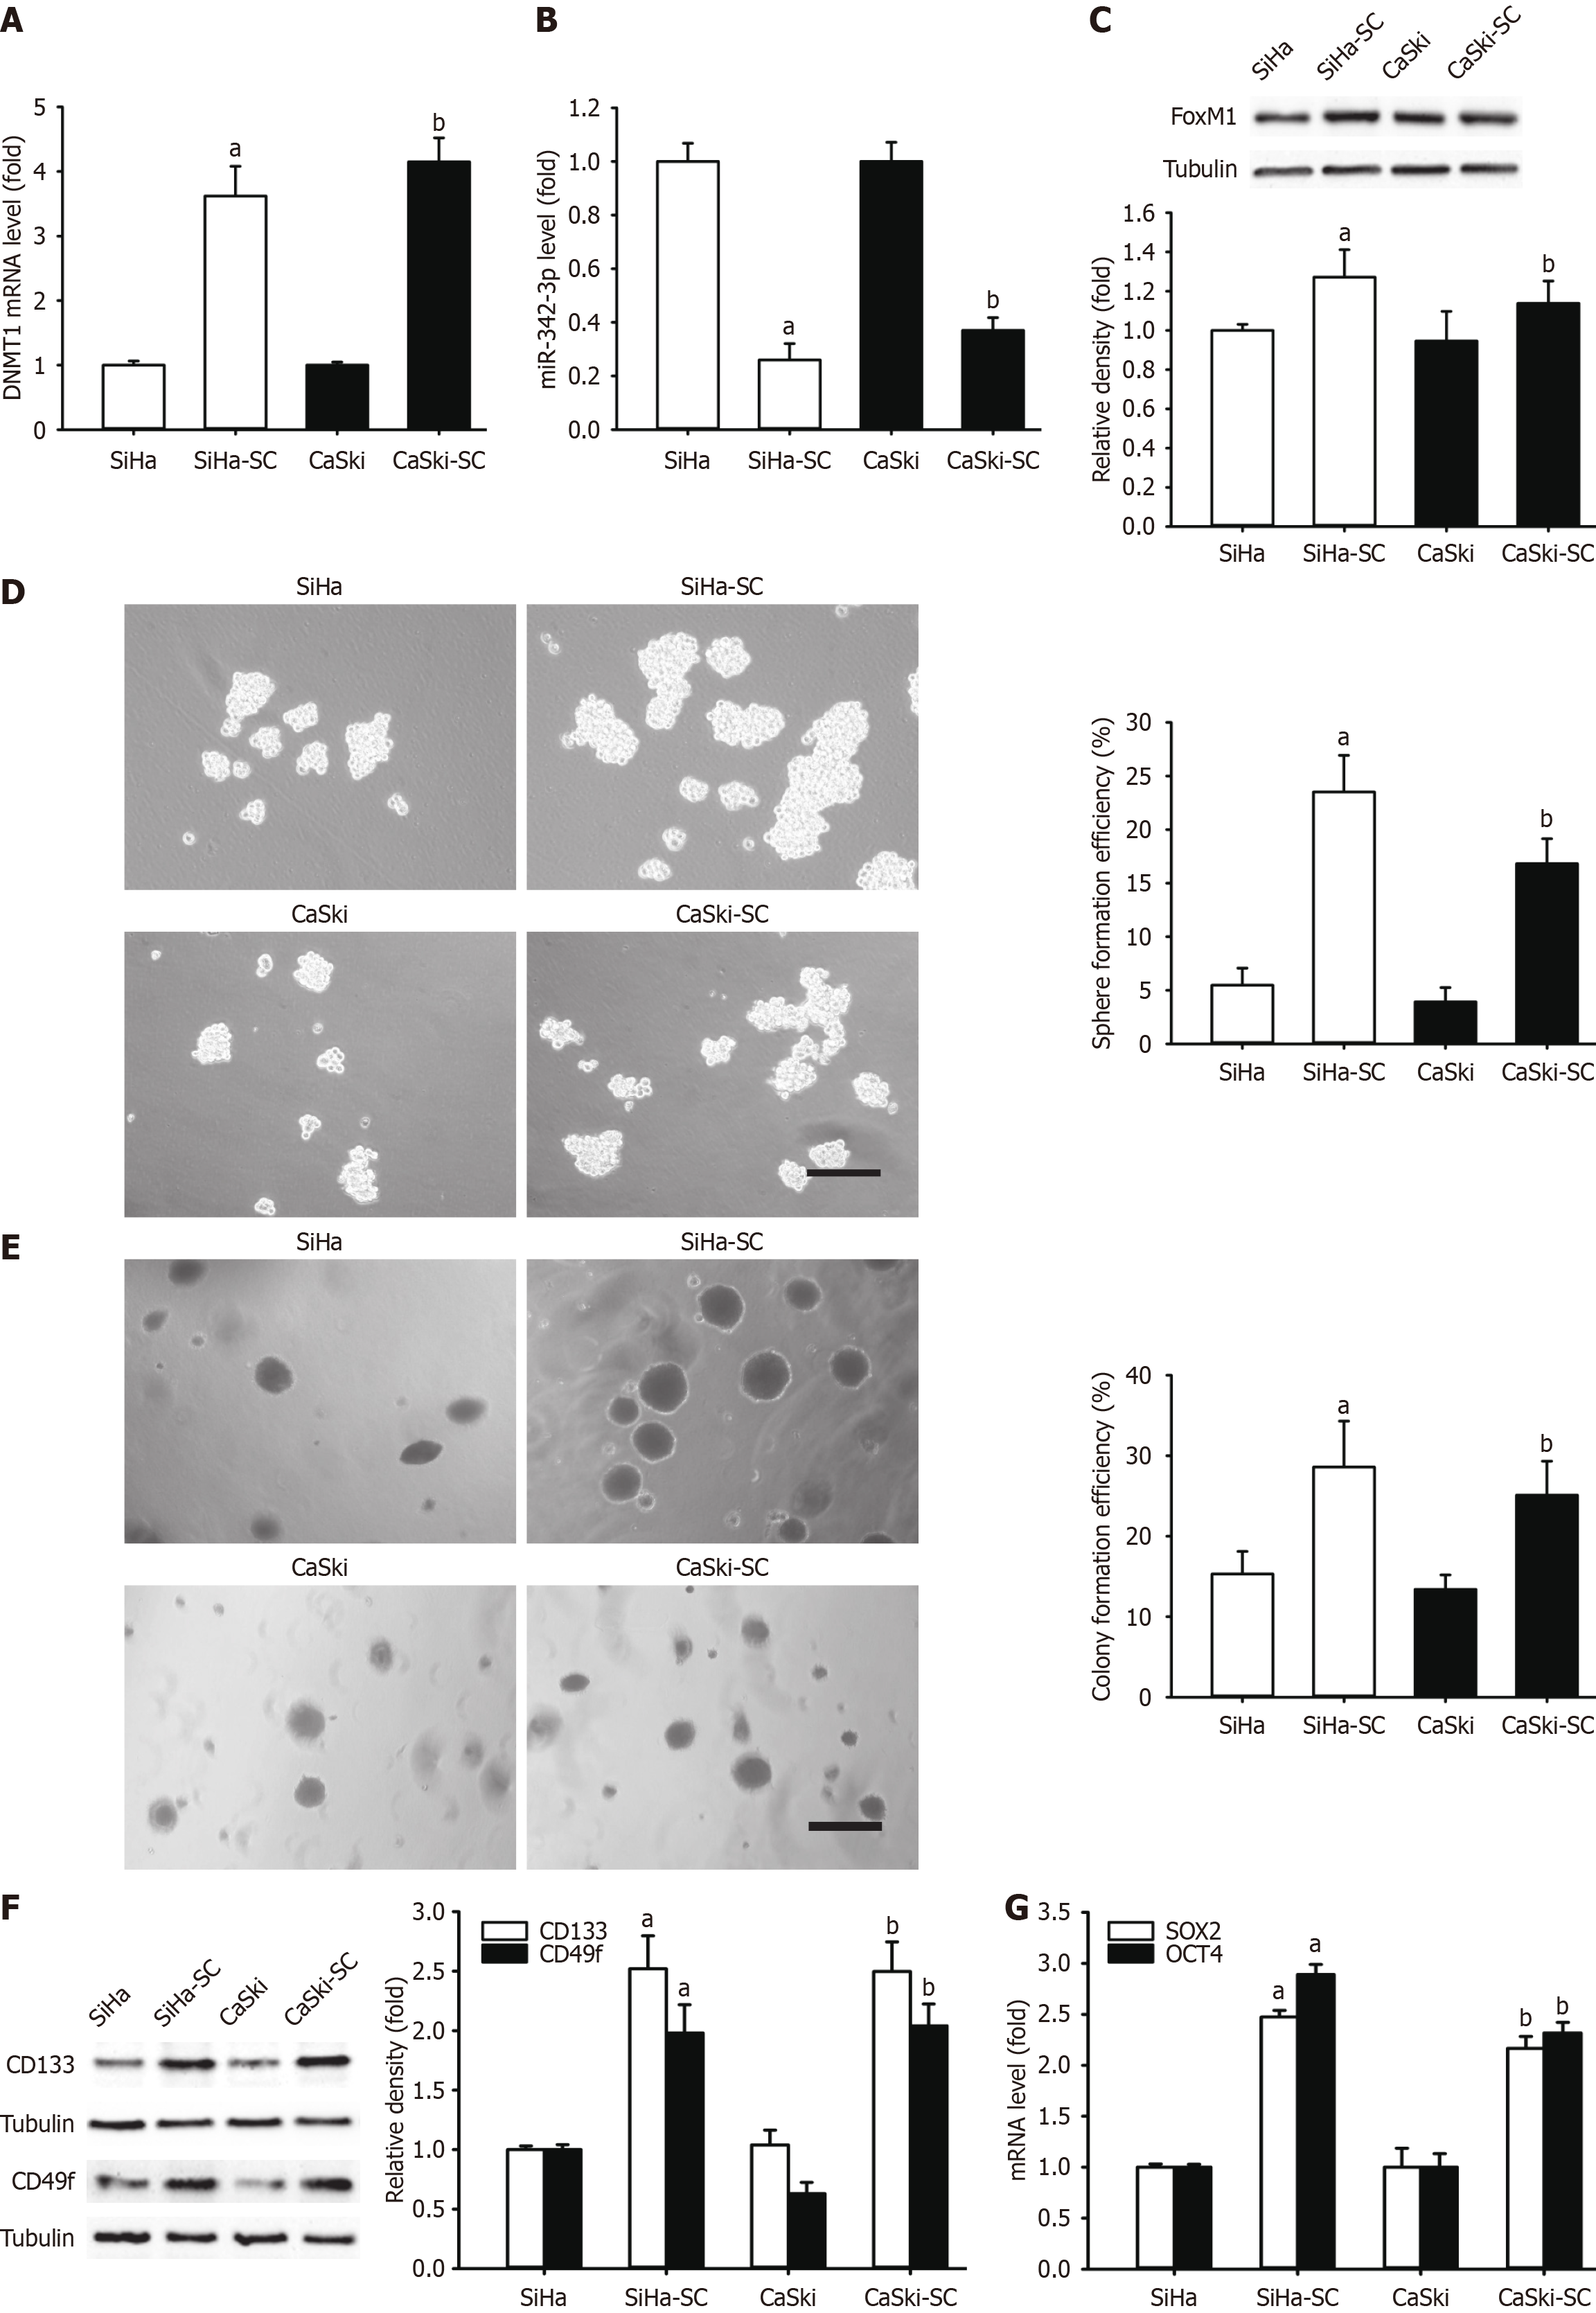
Figure 8 Comparing self-renewal related stemness between SiHa or CaSki cells and the corresponding cervical cancer stem cell-like cells.
A: DNA methyltransferase 1 (DNMT1) mRNA level in SiHa and CaSki cells and their corresponding cervical cancer stem cell-like cells (CCSLCs); B: MicroRNA (miR)-342-3p level in SiHa and CaSki cells and their corresponding CCSLCs; C: Forkhead box M1 (FOXM1) protein expression level SiHa and CaSki cells and their corresponding CCSLCs with α-tubulin as a loading control; D and E: Representative images of spheres and colonies (left) (scale bars = 100 μm); sphere formation efficiency and colony formation efficiency (right) in SiHa and CaSki cells and their corresponding CCSLCs; F: CD133 and CD49f protein amount with α-tubulin as a loading control; G: SRY-box transcription factor 2 (SOX2) and octamer-binding transcription factor 4 (OCT4) mRNA levels in SiHa and CaSki cells and their corresponding CCSLCs. aP < 0.05 vs SiHa cells; bP < 0.05 vs CaSki cells (n = 3). SC: Stem cell.
- Citation: Cao XZ, Zhang YF, Song YW, Yuan L, Tang HL, Li JY, Qiu YB, Lin JZ, Ning YX, Wang XY, Xu Y, Lin SQ. DNA methyltransferase 1/miR-342-3p/Forkhead box M1 signaling axis promotes self-renewal in cervical cancer stem-like cells in vitro and nude mice models. World J Stem Cells 2025; 17(3): 99472
- URL: https://www.wjgnet.com/1948-0210/full/v17/i3/99472.htm
- DOI: https://dx.doi.org/10.4252/wjsc.v17.i3.99472


