Copyright
©The Author(s) 2025.
World J Stem Cells. Jan 26, 2025; 17(1): 98349
Published online Jan 26, 2025. doi: 10.4252/wjsc.v17.i1.98349
Published online Jan 26, 2025. doi: 10.4252/wjsc.v17.i1.98349
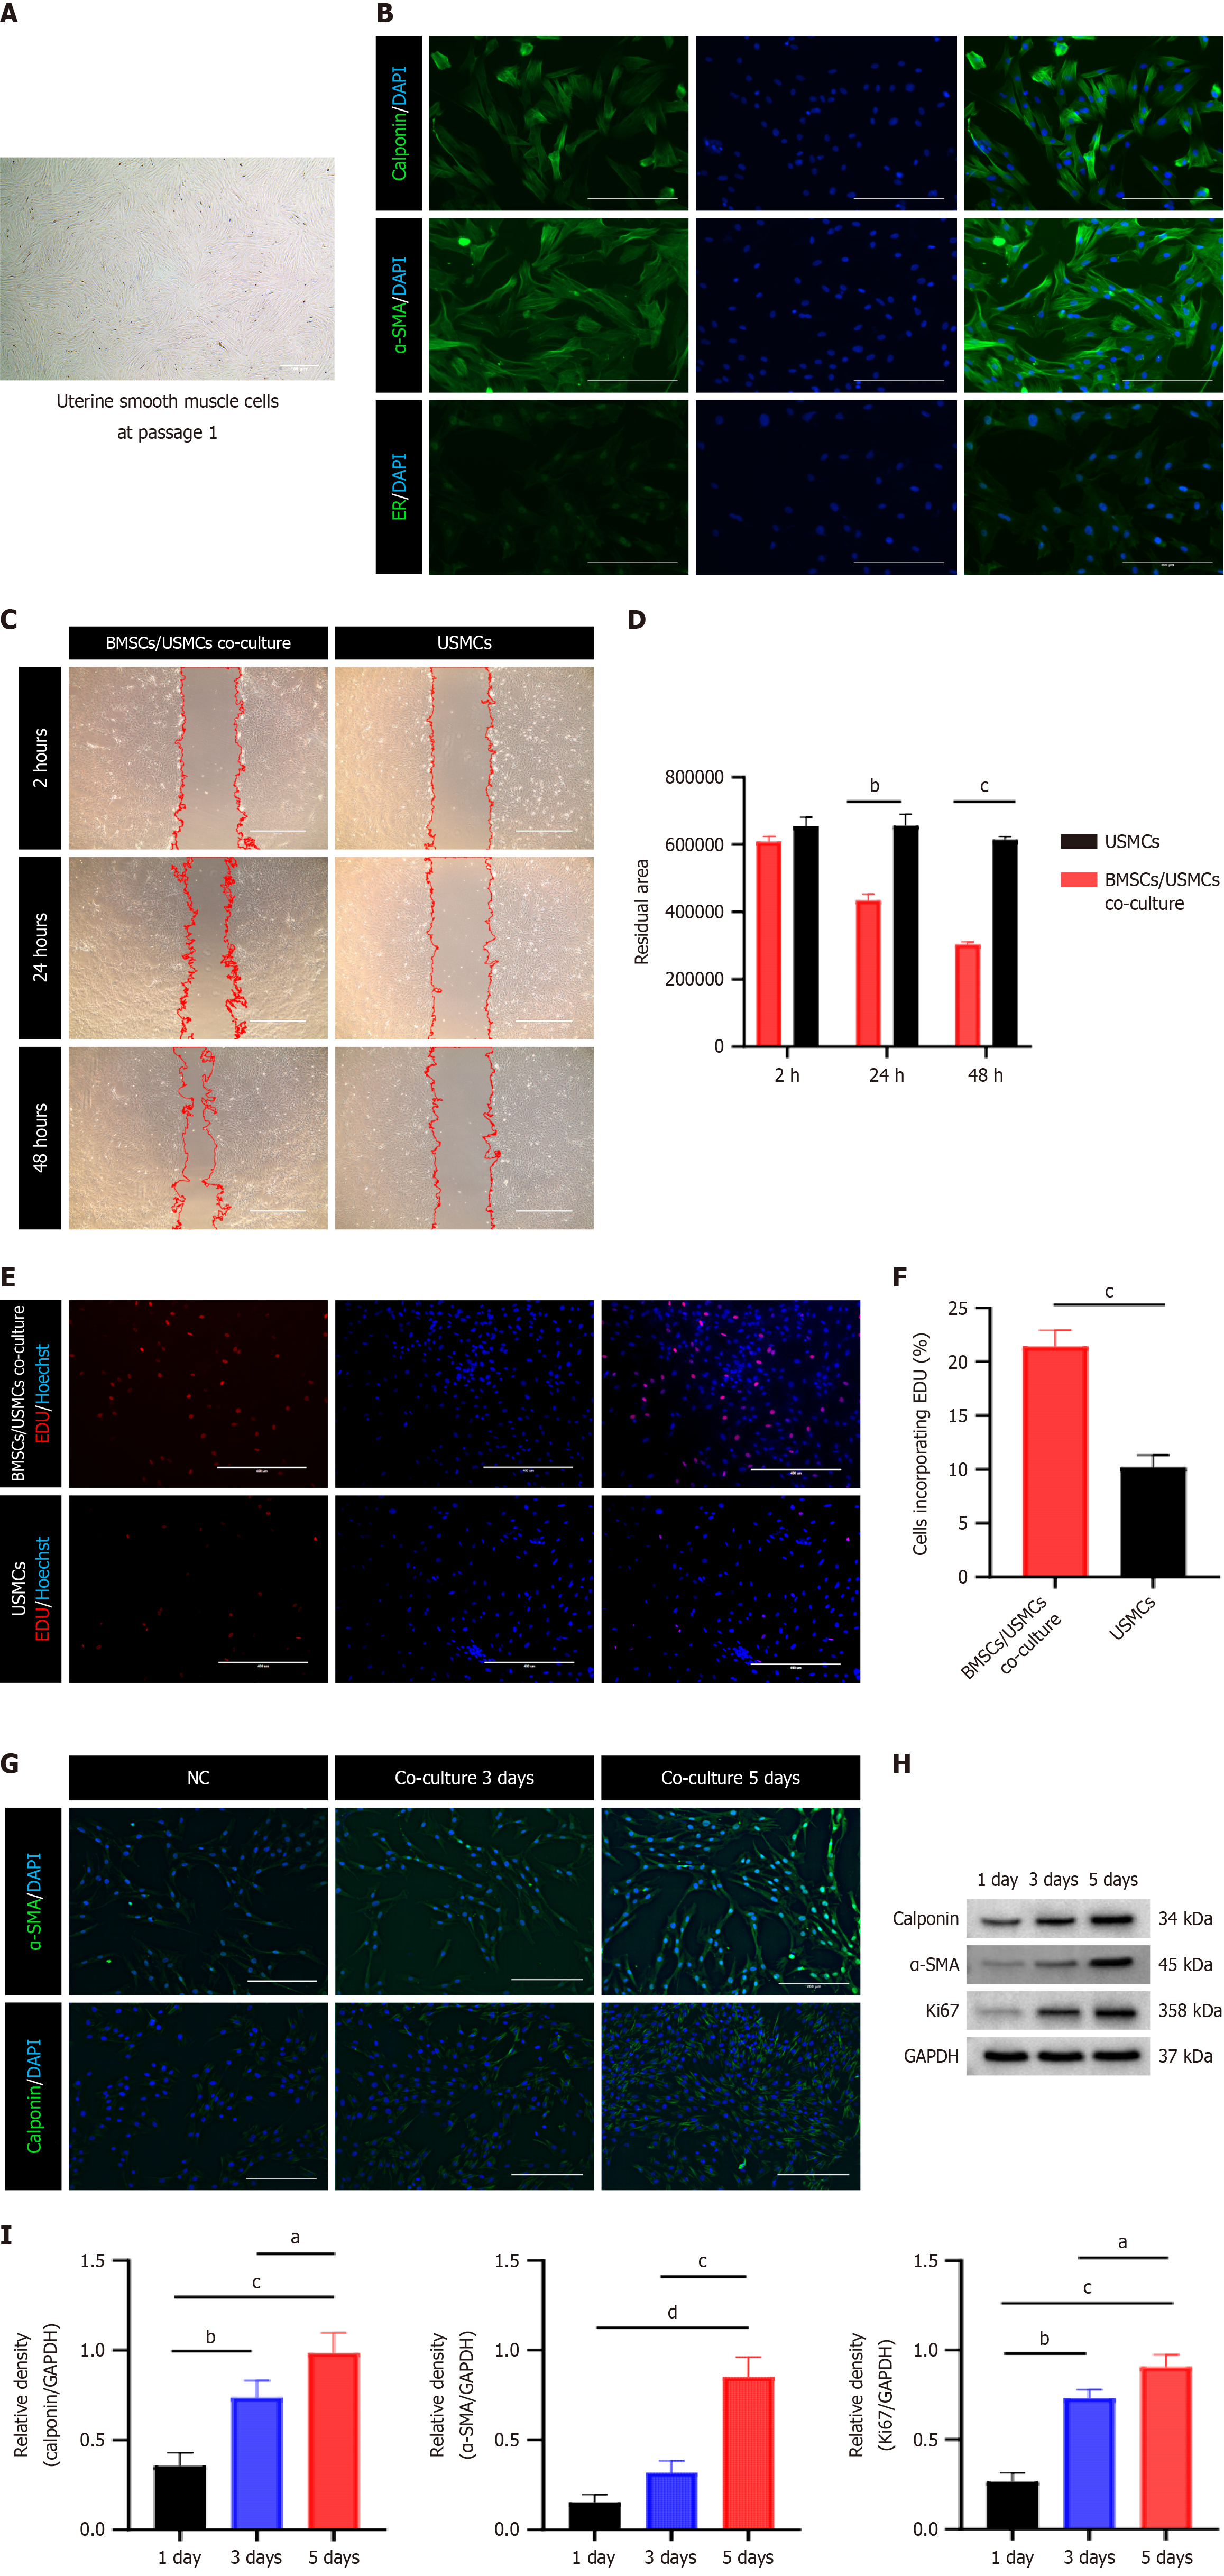
Figure 4 Influence of the microenvironment on uterine smooth muscle cells and bone marrow mesenchymal stem cells.
A: Representative optical micrographs of P1 uterine smooth muscle cells (USMCs) cultured for 7 d (scale bar = 100 μm); B: Immunofluorescence staining for USMC markers, with green fluorescence indicating positivity (scale bar = 200 μm); C: Bright-field image showing USMC migration at 2 h, 24 h, and 48 h, with red dashed lines delineating migration contours (scale bar = 1000 μm); D: Quantification of the residual USMC area. bP < 0.01 vs the USMCs, cP < 0.001 vs the USMCs; E: Fluorescence images depicting the 5-ethynyl-2’-deoxyuridine (EdU) cell proliferation assay used to detect USMC proliferation, where red fluorescence indicates EdU-positive proliferating cells and blue fluorescence indicates Hoechst 33342-positive nuclei (scale bar = 400 μm); F: Percentage of EdU-positive USMCs. cP < 0.001 vs USMCs; G: Immunofluorescence staining of alpha-smooth muscle actin (α-SMA) and calponin in bone marrow mesenchymal stem cells (BMSCs). Green indicates positivity, and the fluorescence intensity reflects the expression level (scale bar = 200 μm); H: Western blot analysis of α-SMA, calponin, and the Kiel-67 marker of proliferation (Ki67) expression in BMSCs cocultured with USMCs for 1, 3, or 5 d; I: Statistical analysis of relative protein levels at different coculture times. aP < 0.05 vs the 3-d group, bP < 0.01 vs the 1-d group, cP < 0.001 vs the 1-d and 3-d groups, dP < 0.001 vs the 1-d group. ImageJ software was used to process the images. The data are presented as the mean ± SD, n = 3 per group. P values for D were determined via two-way ANOVA, and those for I were determined via one-way ANOVA. Comparisons between two groups in F were conducted via a t test. ER: Estrogen receptor.
- Citation: Yang J, Yuan J, Wen YQ, Wu L, Liao JJ, Qi HB. Bone marrow mesenchymal stem cells promote uterine healing by activating the PI3K/AKT pathway and modulating inflammation in rat models. World J Stem Cells 2025; 17(1): 98349
- URL: https://www.wjgnet.com/1948-0210/full/v17/i1/98349.htm
- DOI: https://dx.doi.org/10.4252/wjsc.v17.i1.98349


