Copyright
©The Author(s) 2024.
World J Stem Cells. Jun 26, 2024; 16(6): 708-727
Published online Jun 26, 2024. doi: 10.4252/wjsc.v16.i6.708
Published online Jun 26, 2024. doi: 10.4252/wjsc.v16.i6.708
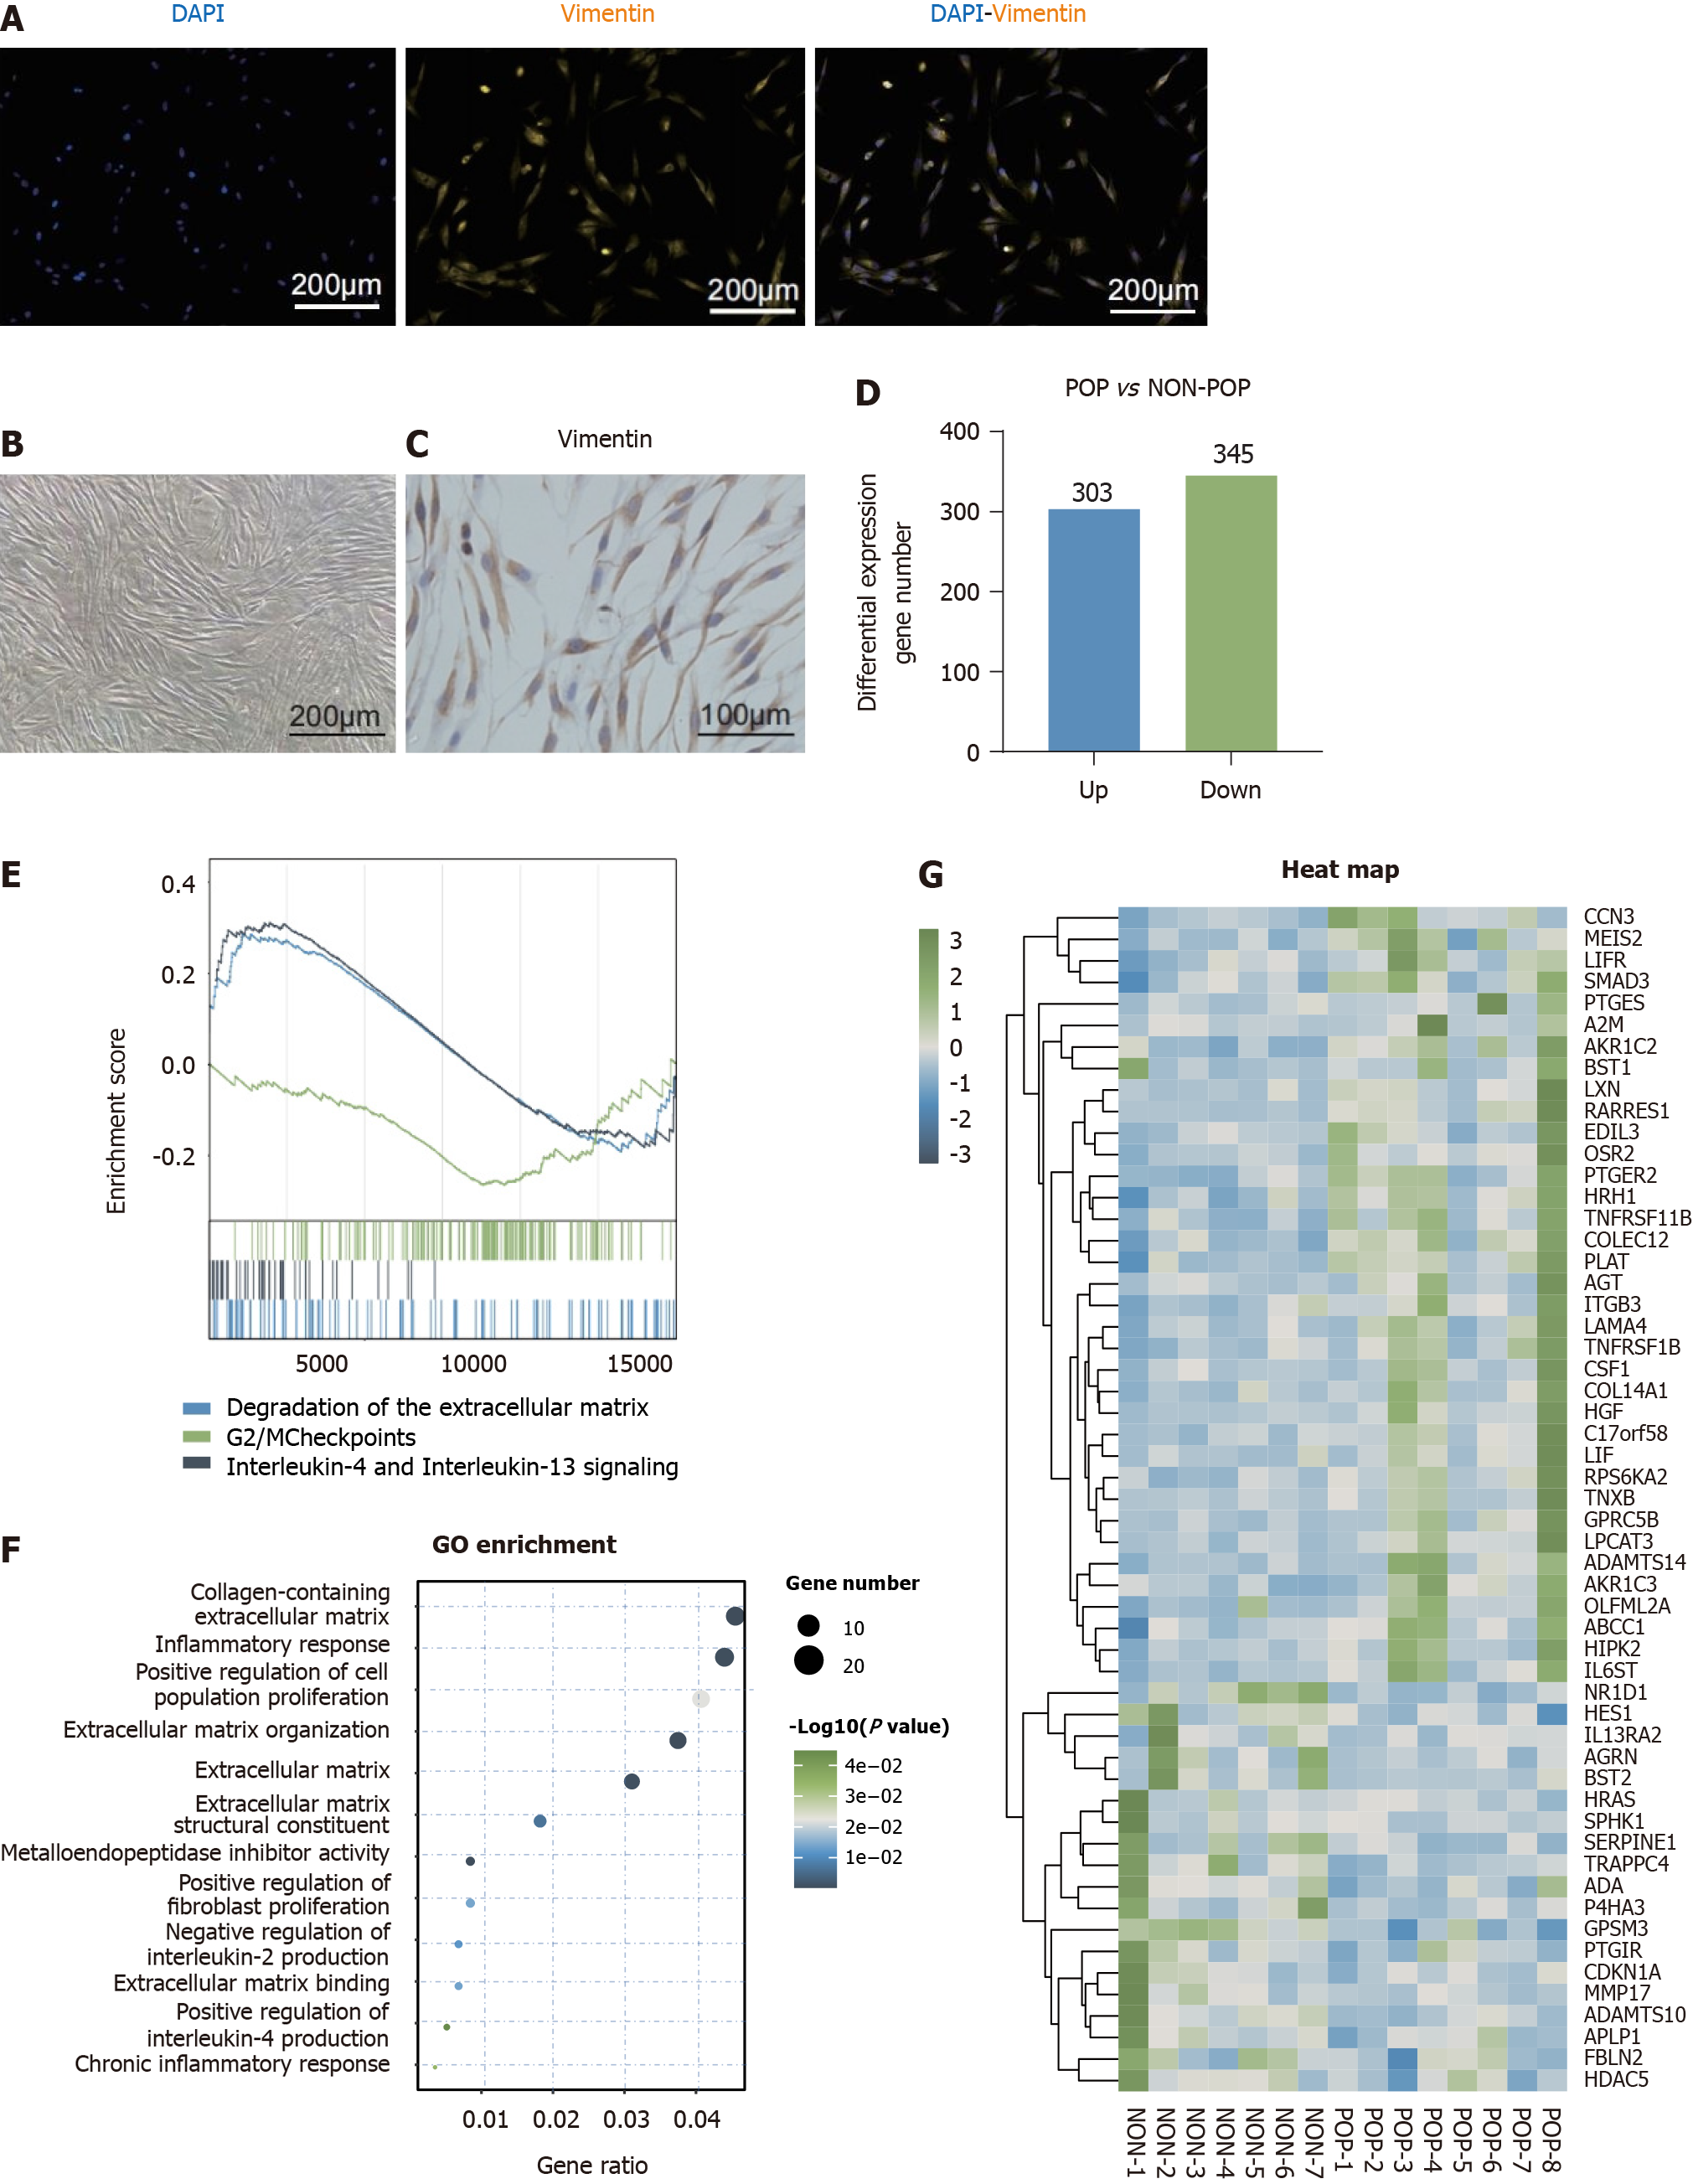
Figure 3 Differences in the gene expression profiles of human primary vaginal fibroblasts between the pelvic organ prolapse and non-pelvic organ prolapse groups.
A: Images of primary vaginal fibroblasts for immunofluorescence; B: Images of primary vaginal fibroblasts for brightfield microscopy; C: Images of primary vaginal fibroblasts for immunohistochemistry; D: Number of differentially expressed genes (DEGs) between the pelvic organ prolapse (POP) and non-POP groups (fold change > 1.5, P < 0.05); E: Transcriptomic data were analyzed by Gene set enrichment analysis (false discovery rate > 0.25, P < 0.05); F: The above DEGs were further analyzed using Gene Ontology analysis (P < 0.05); G: Heatmaps were generated to show the DEGs of the two groups with respect to the previously mentioned terms. POP: Pelvic organ prolapse; GO: Gene Ontology.
- Citation: Xu LM, Yu XX, Zhang N, Chen YS. Exosomes from umbilical cord mesenchymal stromal cells promote the collagen production of fibroblasts from pelvic organ prolapse. World J Stem Cells 2024; 16(6): 708-727
- URL: https://www.wjgnet.com/1948-0210/full/v16/i6/708.htm
- DOI: https://dx.doi.org/10.4252/wjsc.v16.i6.708


