Copyright
©The Author(s) 2024.
World J Stem Cells. Jun 26, 2024; 16(6): 690-707
Published online Jun 26, 2024. doi: 10.4252/wjsc.v16.i6.690
Published online Jun 26, 2024. doi: 10.4252/wjsc.v16.i6.690
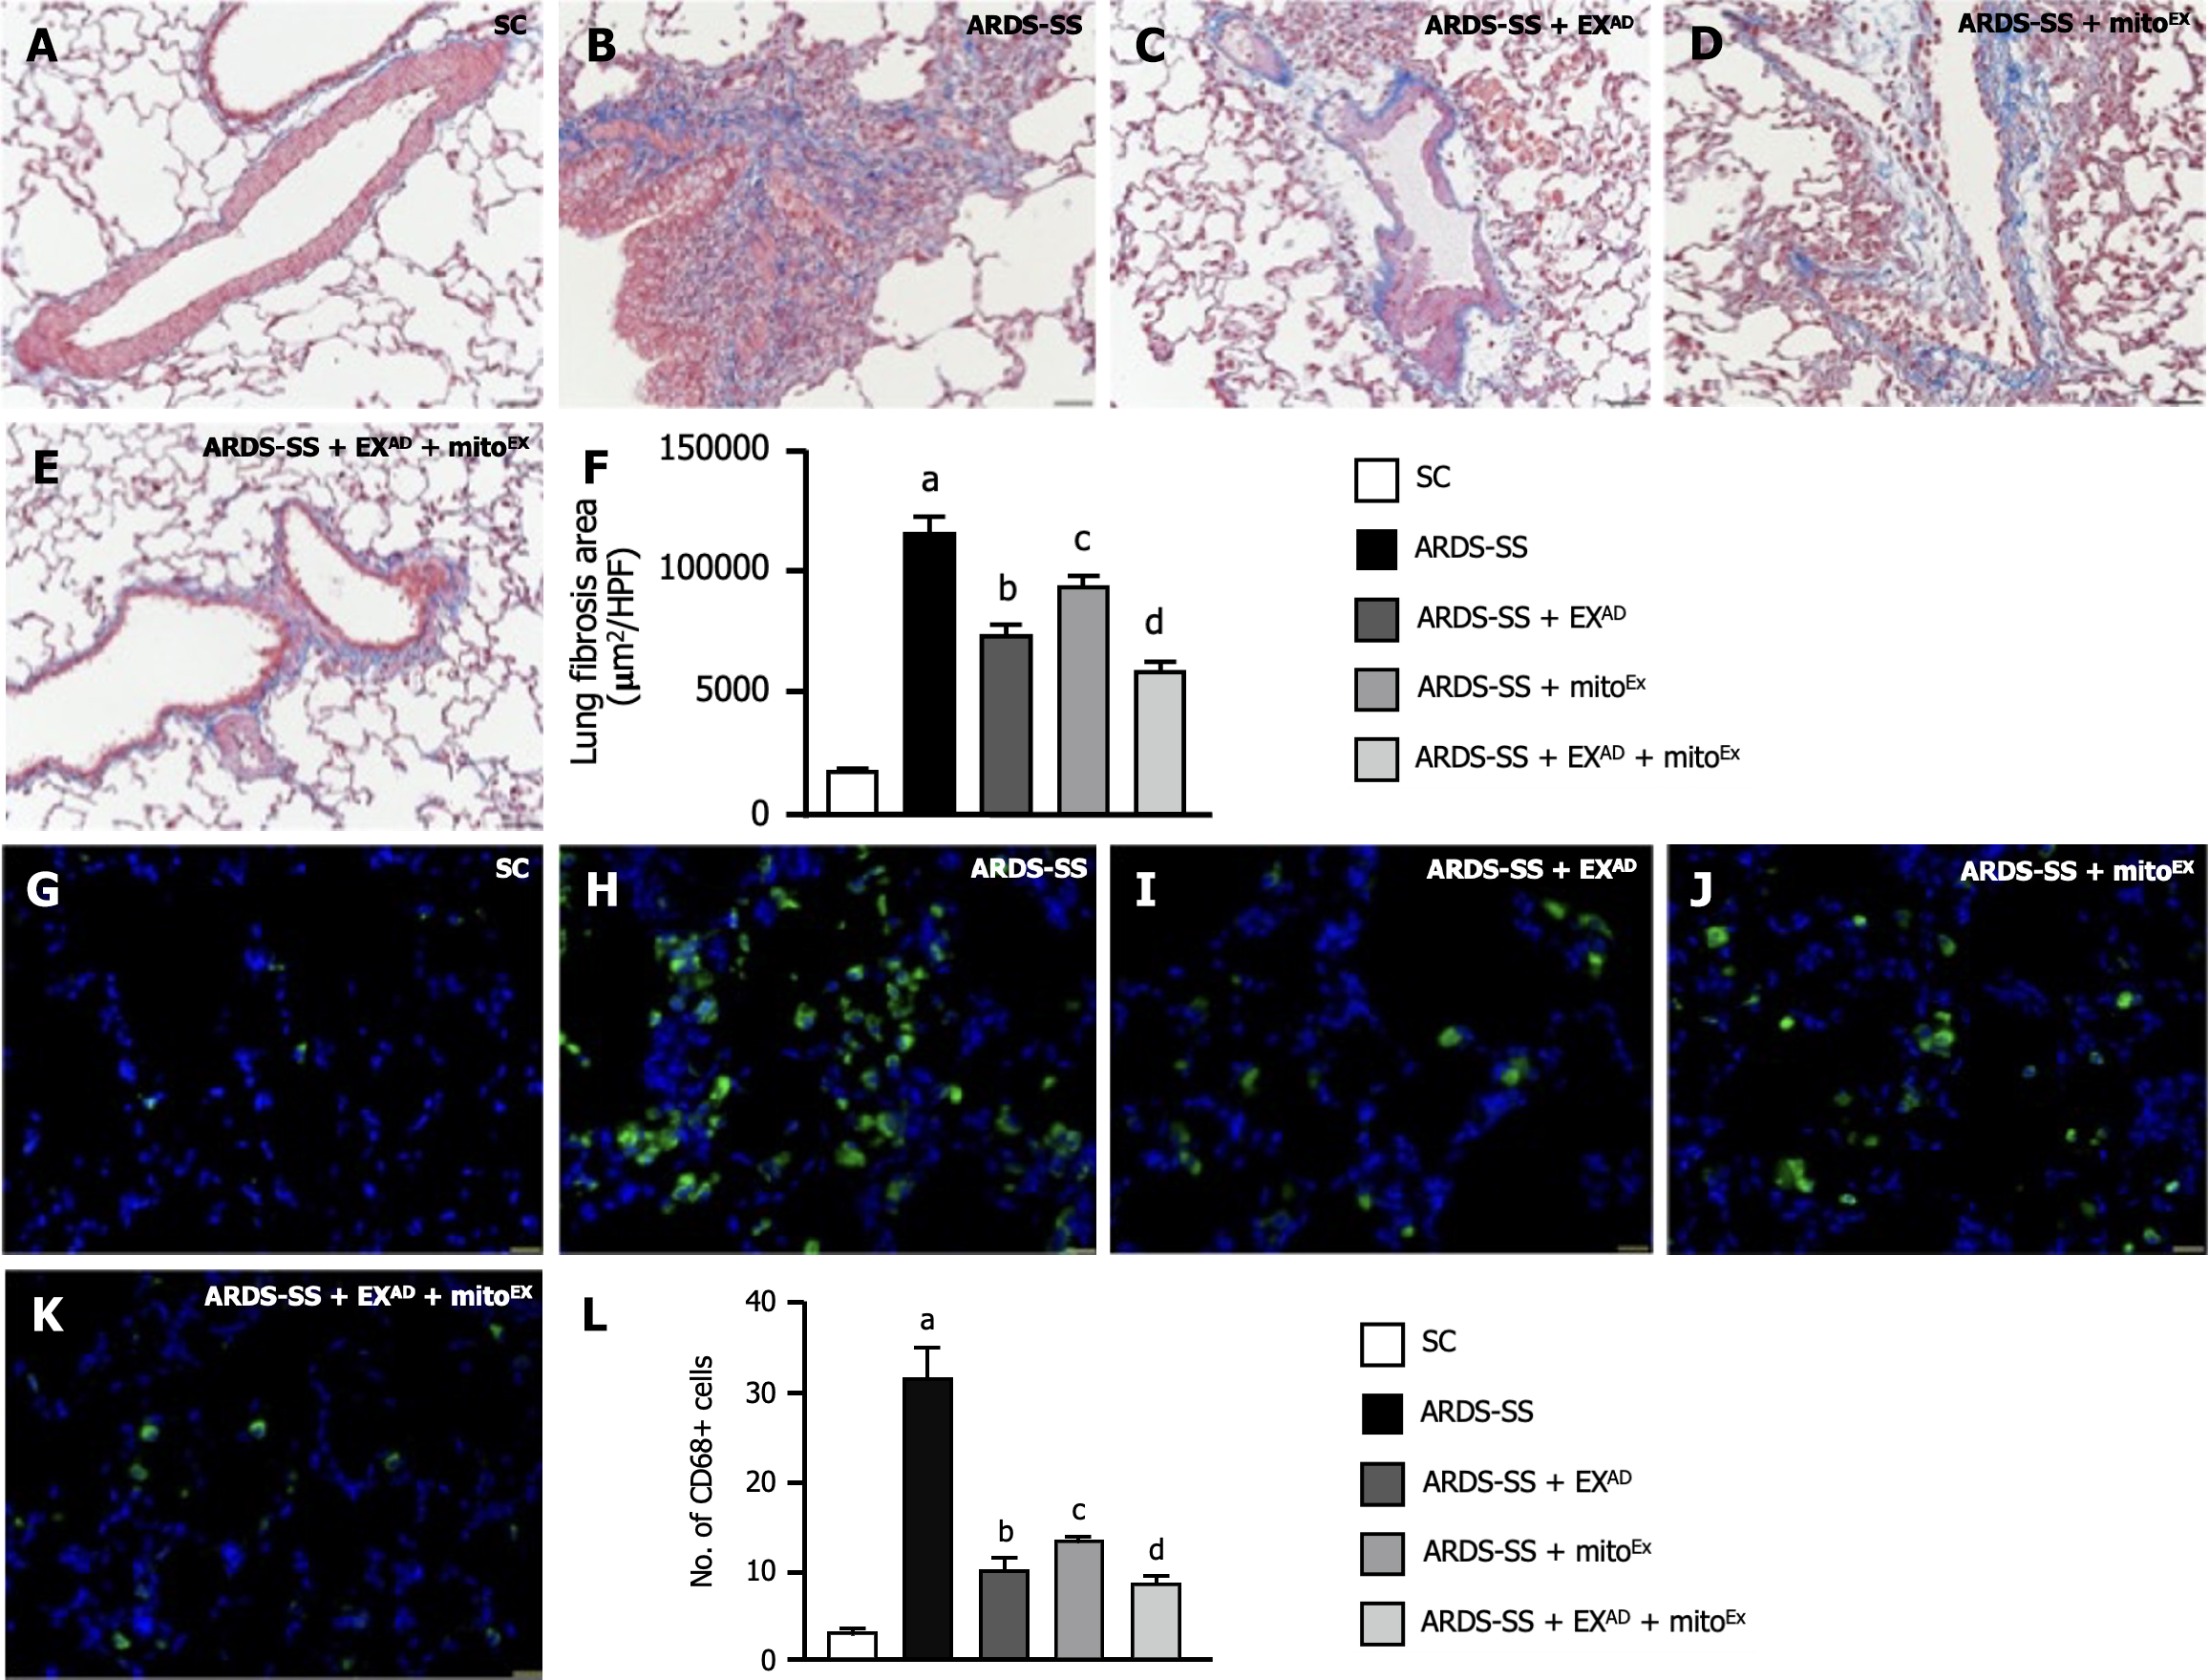
Figure 11 Cellular levels of fibrosis and inflammation by day 5 after acute respiratory distress syndrome induction.
A-E: Showing the microscopic finding (200 ×) of Masson’s trichome stain for identification of fibrosis in lung fibrosis (blue color); F: Analytical result of fibrotic area, control vs other groups with different letters, aP < 0.0001, bP < 0.05, cP < 0.01, dP < 0.001. The scale bars in right lower corner represent 50 μm; G-K: Illustrating the immunofluorescent microscopic finding (400 ×) for identification of cellular expression of CD68 (green color); L: Analytical result of number of CD68+ cells, control vs other groups with different letters, aP < 0.0001, bP < 0.05, cP < 0.01, dP < 0.001. The scale bars in right lower corner represent 20 μm. All statistical analyses were performed by one-way ANOVA, followed by Bonferroni multiple comparison post hoc test (n = 6 for each group). SC: Sham-operated control; ARDS: Acute respiratory distress syndrome; SS: Sepsis syndrome; mitoEx: Exogenous mitochondria; EXAD: Adipose-derived mesenchymal stem cells-derived exosomes.
- Citation: Lin KC, Fang WF, Yeh JN, Chiang JY, Chiang HJ, Shao PL, Sung PH, Yip HK. Outcomes of combined mitochondria and mesenchymal stem cells-derived exosome therapy in rat acute respiratory distress syndrome and sepsis. World J Stem Cells 2024; 16(6): 690-707
- URL: https://www.wjgnet.com/1948-0210/full/v16/i6/690.htm
- DOI: https://dx.doi.org/10.4252/wjsc.v16.i6.690


