Copyright
©The Author(s) 2024.
World J Stem Cells. Jun 26, 2024; 16(6): 690-707
Published online Jun 26, 2024. doi: 10.4252/wjsc.v16.i6.690
Published online Jun 26, 2024. doi: 10.4252/wjsc.v16.i6.690
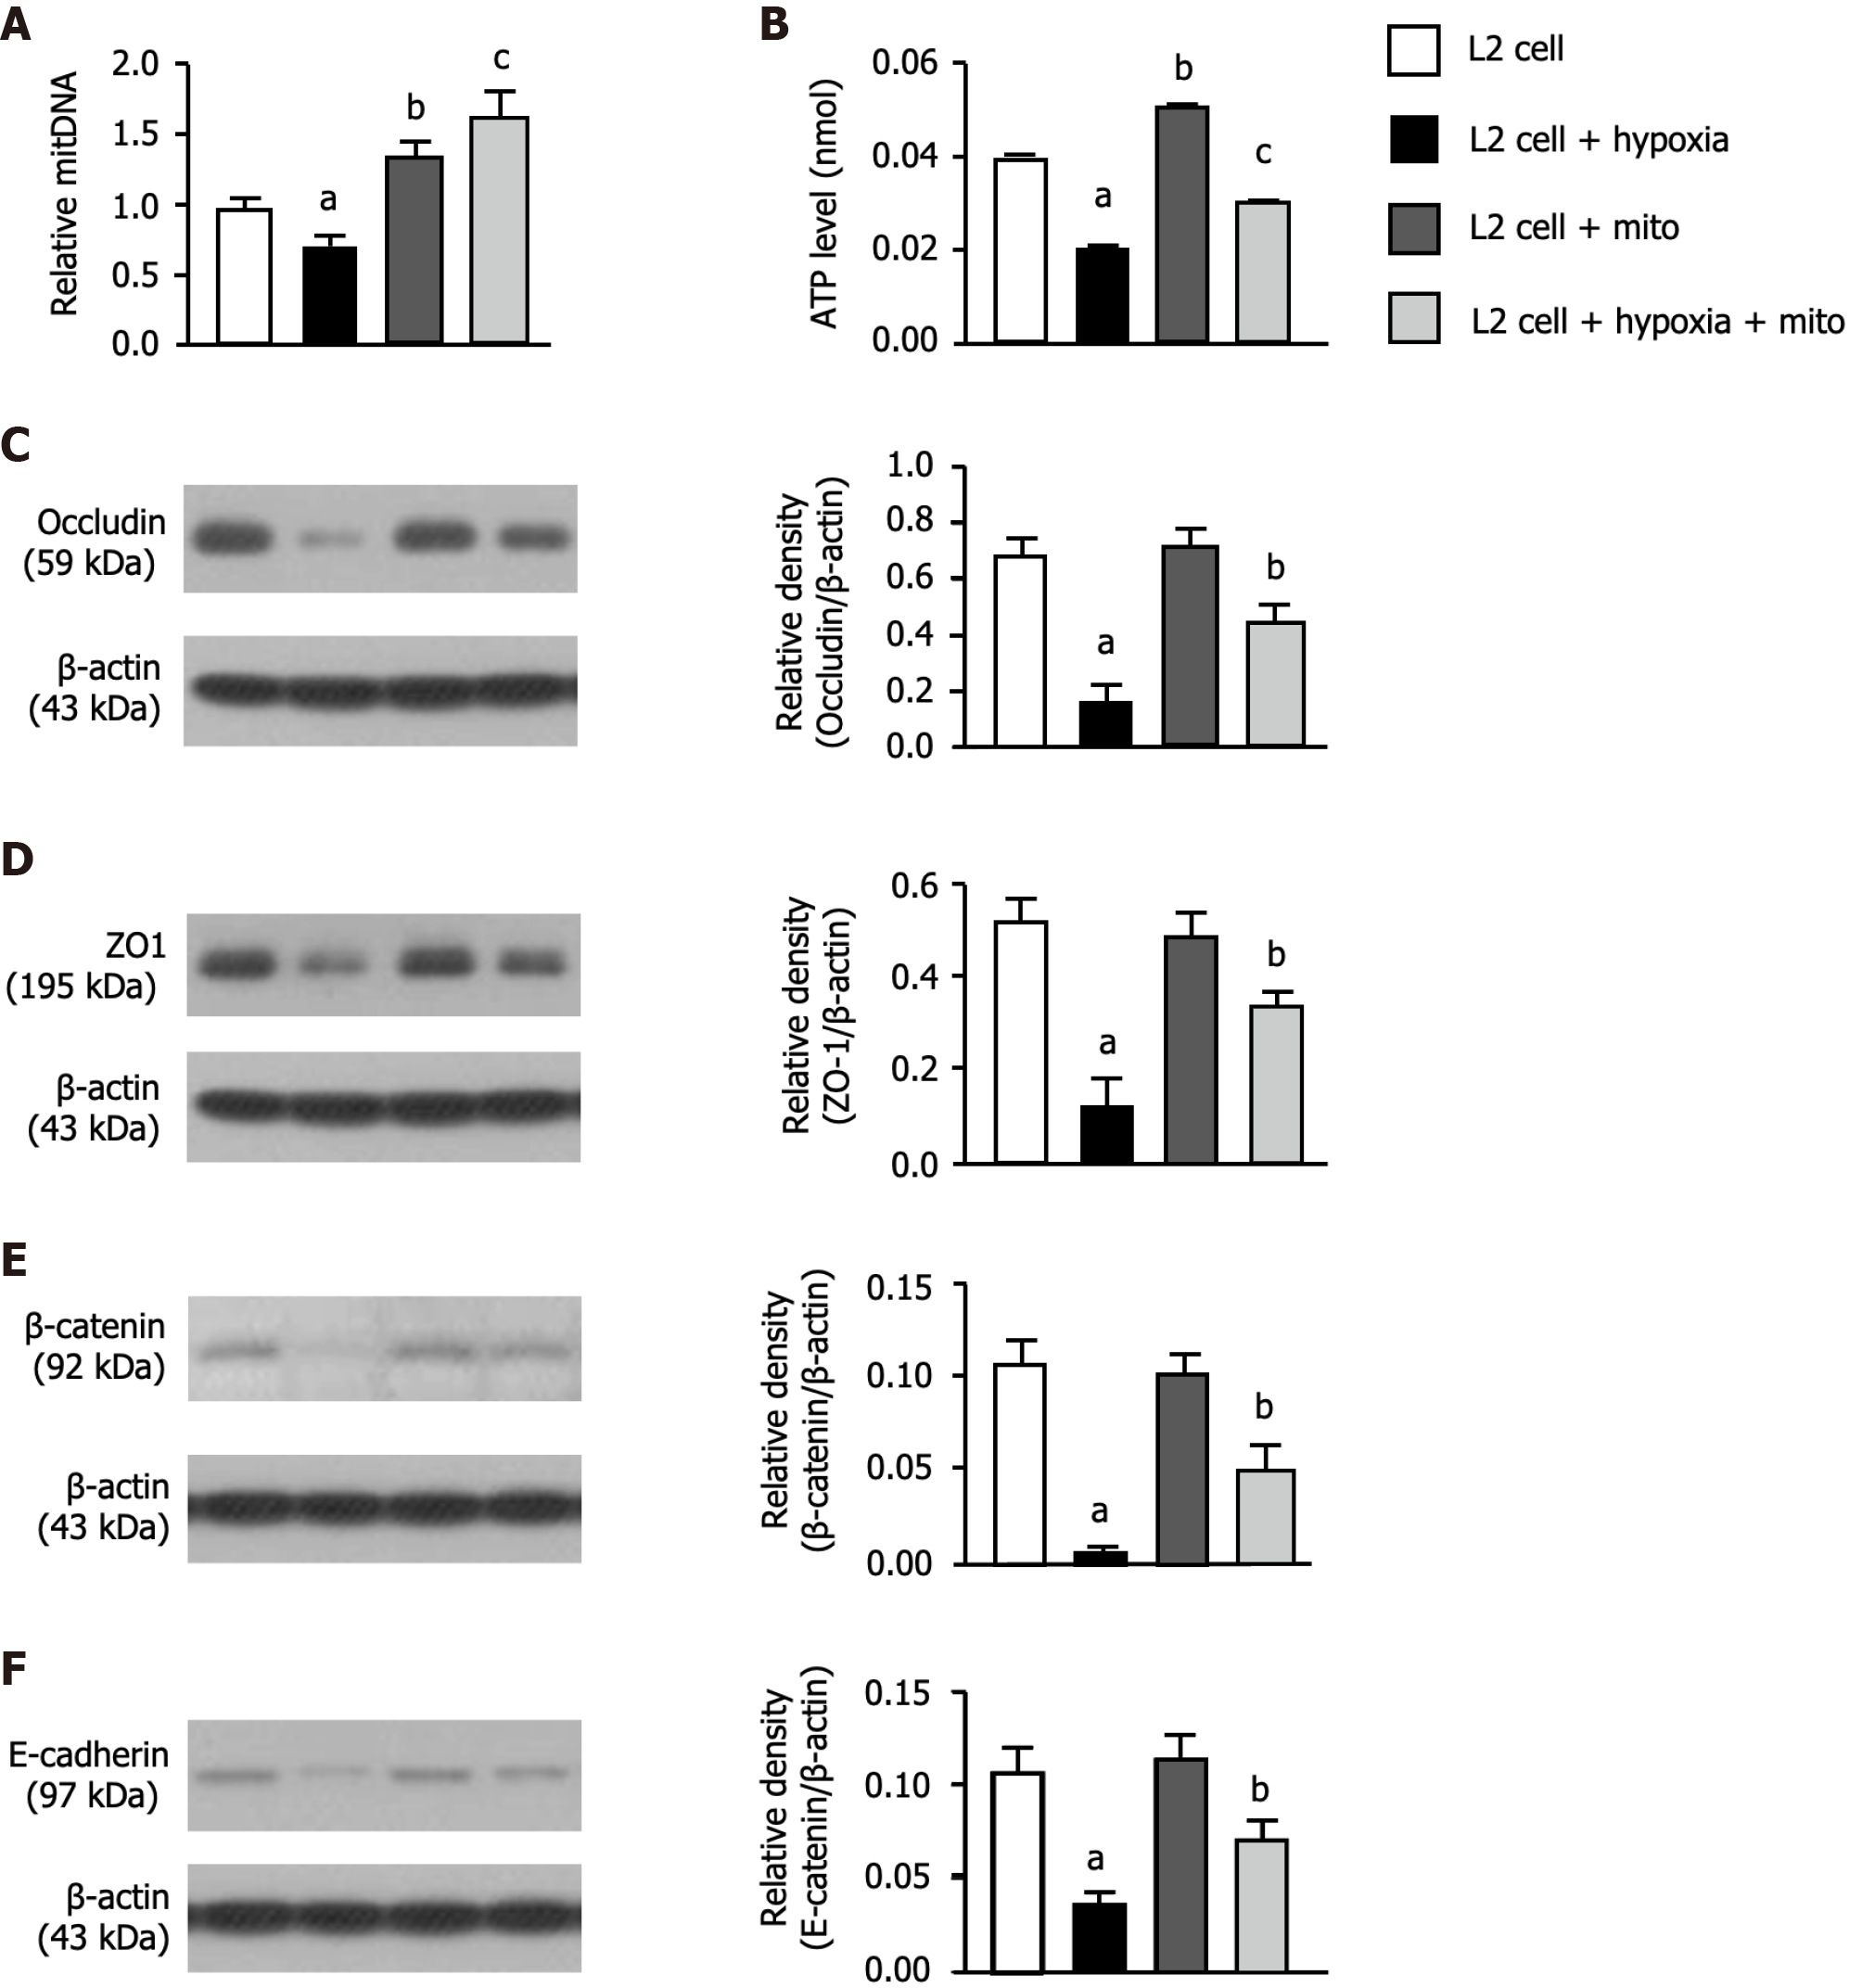
Figure 3 Protein expressions of cellular junctions, relative mitochondrial DNA expression and adenosine triphosphate concentration.
A: Relative mitochondrial DNA expression, control vs other groups with different letters, aP < 0.01, bP < 0.05, cP < 0.001 (n = 6 for each group); B: Concentration level of adenosine triphosphate, control vs other groups with different letters, aP < 0.01, bP < 0.05, cP < 0.001 (n = 6 for each group); C: Protein expression of occludin, control vs other groups with different symbols, aP < 0.001, bP < 0.01; D: Protein expression of β-catenin, control vs other groups with different letters, aP < 0.001, bP < 0.01; E: Protein expression of zonula occludens-1, control vs other groups with different letters, aP < 0.001, bP < 0.01; F: Protein expression of E-cadherin, control vs other groups with different letters, aP < 0.001, bP < 0.01 (n = 4 for each group). All statistical analyses were performed by one-way ANOVA, followed by Bonferroni multiple comparison post hoc test. Grouping: L2 cells; L2 cells + hypoxia; L2 cells + mitochondria (100 μg); L2 cells + hypoxia + mitochondria (100 μg).
- Citation: Lin KC, Fang WF, Yeh JN, Chiang JY, Chiang HJ, Shao PL, Sung PH, Yip HK. Outcomes of combined mitochondria and mesenchymal stem cells-derived exosome therapy in rat acute respiratory distress syndrome and sepsis. World J Stem Cells 2024; 16(6): 690-707
- URL: https://www.wjgnet.com/1948-0210/full/v16/i6/690.htm
- DOI: https://dx.doi.org/10.4252/wjsc.v16.i6.690


