Copyright
©The Author(s) 2024.
World J Stem Cells. Jun 26, 2024; 16(6): 690-707
Published online Jun 26, 2024. doi: 10.4252/wjsc.v16.i6.690
Published online Jun 26, 2024. doi: 10.4252/wjsc.v16.i6.690
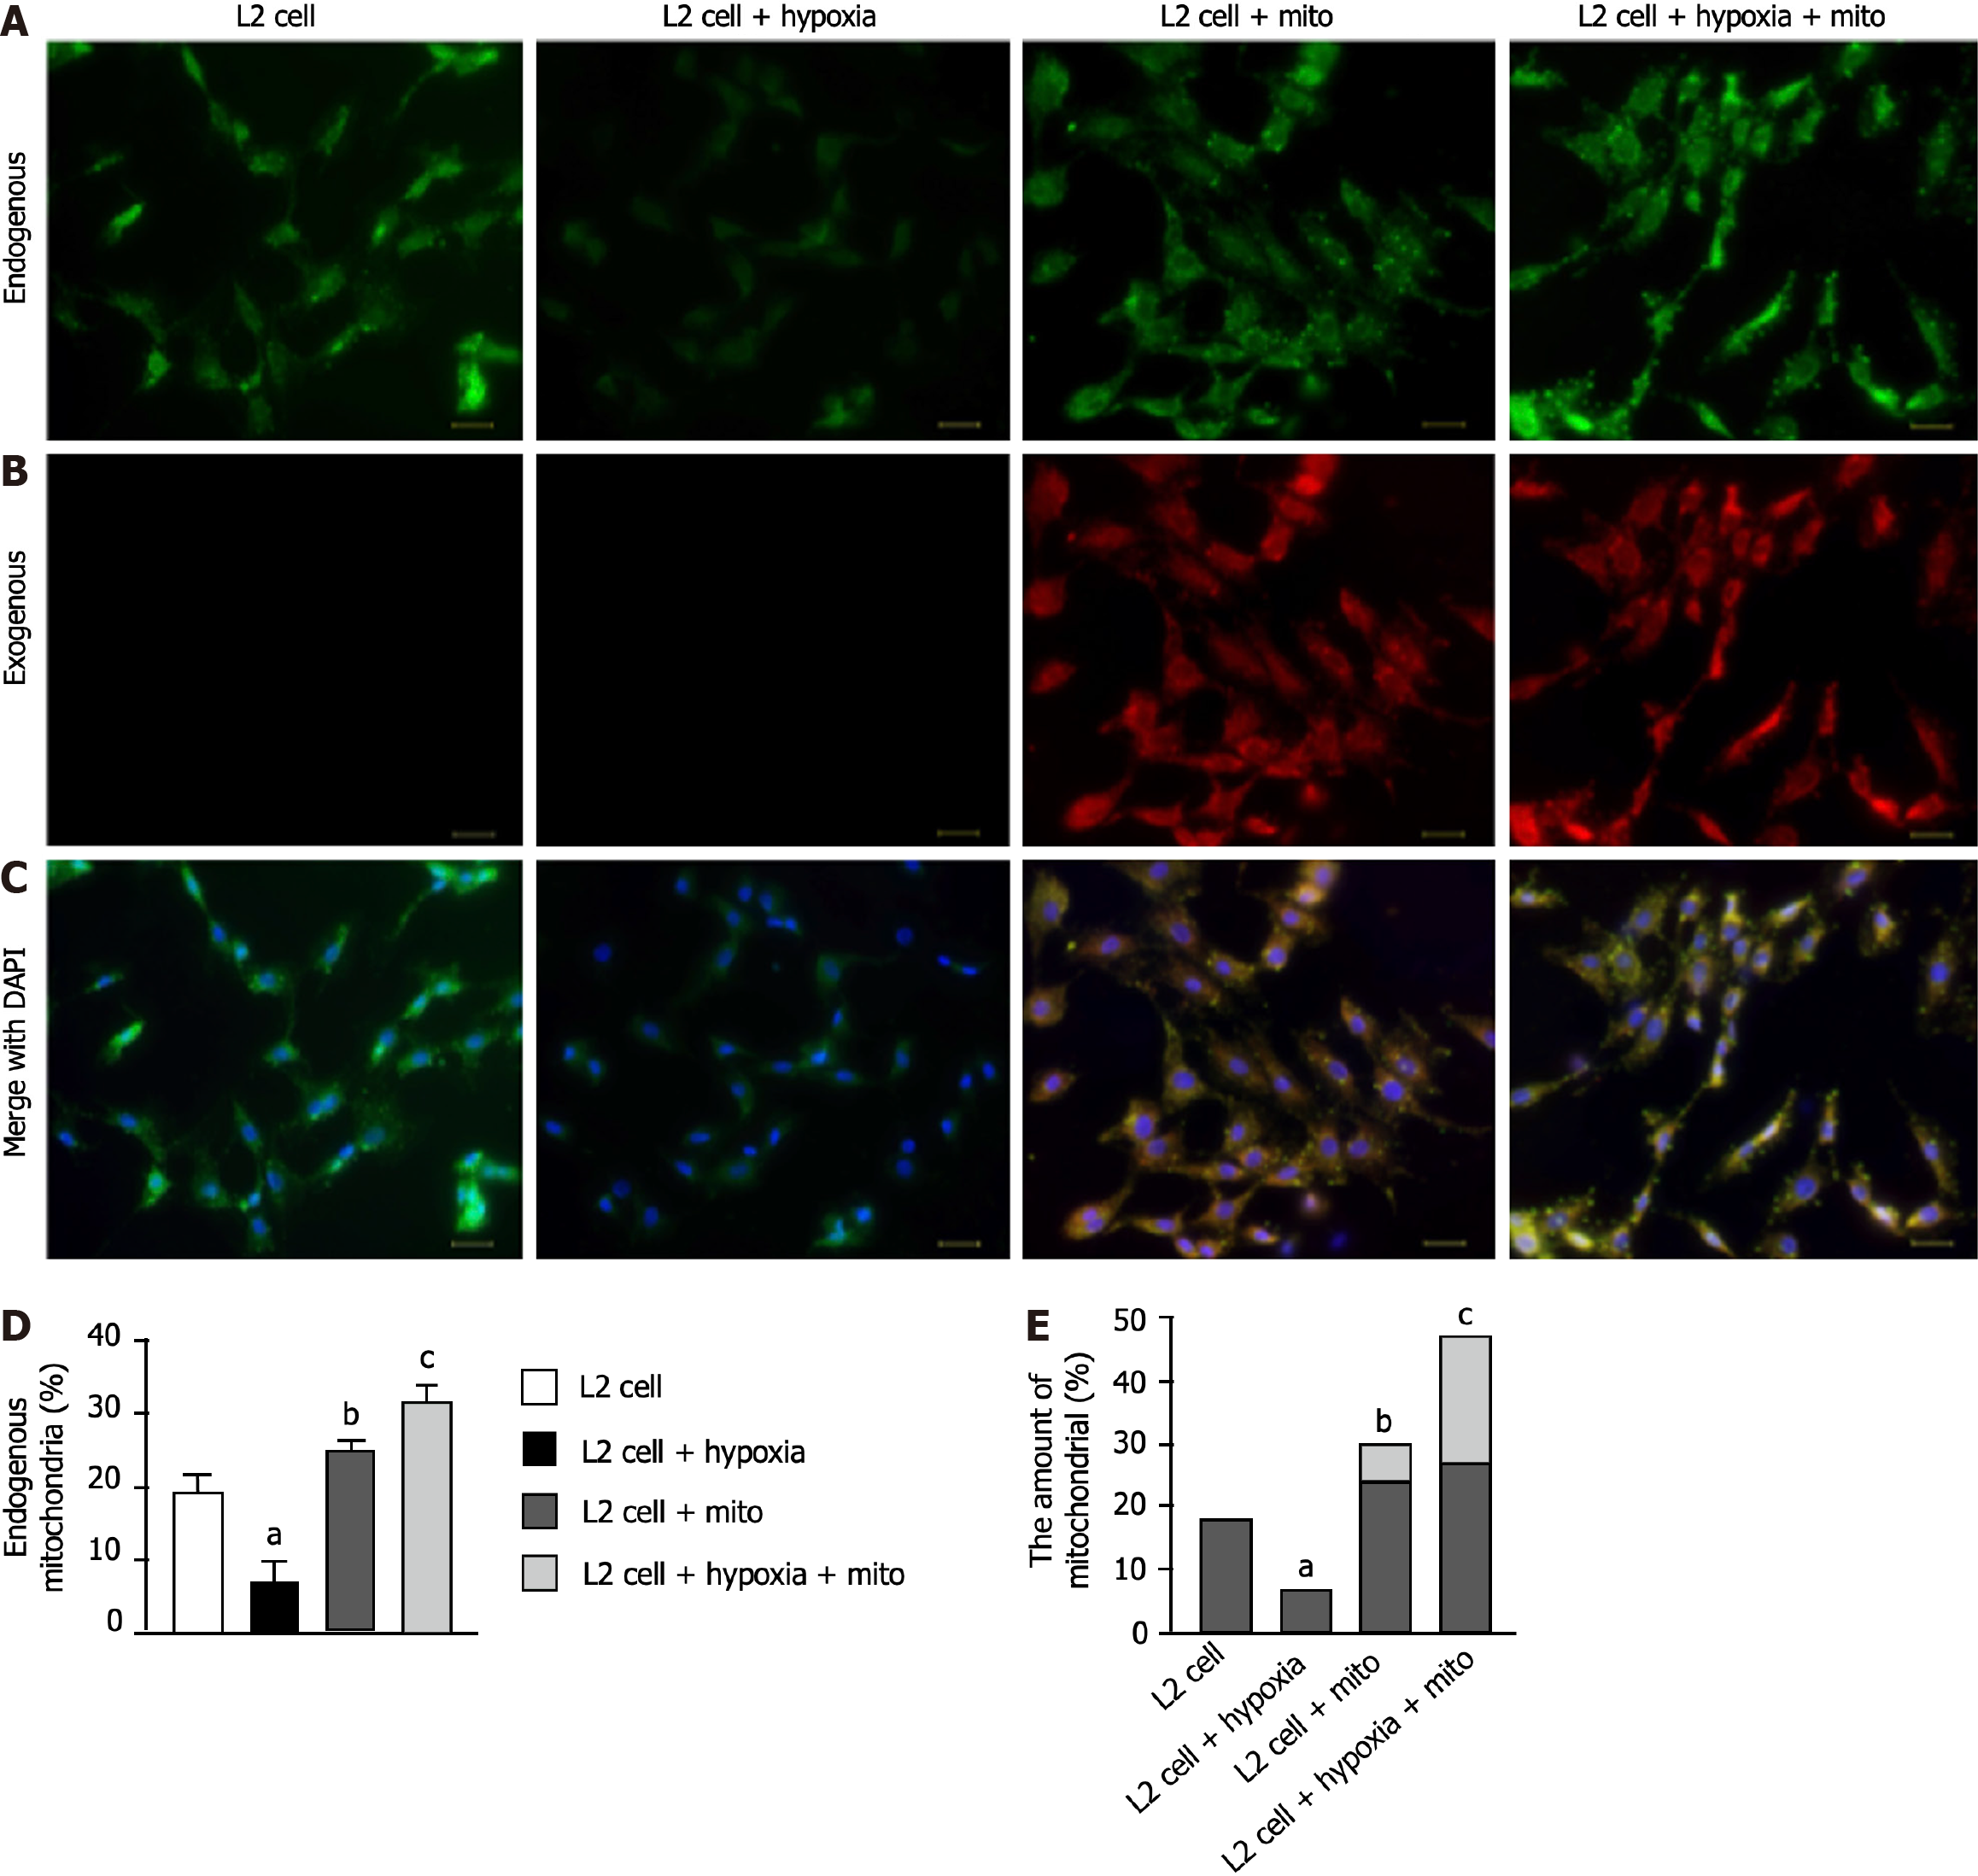
Figure 2 Immunofluorescent microscopic finding for elucidating the ability of exogenous mitochondria transfusion into the L2 cells.
A: Demonstrating MitoTracker stain (400 ×) for identifying endogenous mitochondria (green color) among four groups; B: Indicating the MitoTracker stain (400 ×) for identifying exogenous mitochondria to be transfused into the L2 cells (red color); C: Denoting the merged picture of a4 to b4 (i.e., endogenous and exogenous mitochondrial staining). Pink-yellow color indicated the endogenous and exogenous mitochondria colocalized together. Abundant mitochondria were found in c3 and c4 groups. Blue color in c1 to c4 indicated the DAPI stain (400 ×) for identifying rat lung epithelial cells (i.e., L2 cell line) in four groups. Scale bars in right lower corner represent 20 μm; D: Analytical result of endogenous mitochondrial expression (%); E: Analytical result of combined expression of endogenous and exogenous mitochondrial amount. Dark bar chart indicated percentage of endogenous mitochondria, whereas gray color indicated percentage of exogenous mitochondria. All statistical analyses were performed by one-way ANOVA, followed by Bonferroni multiple comparison post hoc test (n = 5 for each group). Control vs other groups with different letters, aP < 0.01, bP < 0.05, cP < 0.001. Grouping: L2 cells; L2 cells + hypoxia; L2 cells + mitochondria (100 μg); L2 cells + hypoxia + mitochondria (100 μg).
- Citation: Lin KC, Fang WF, Yeh JN, Chiang JY, Chiang HJ, Shao PL, Sung PH, Yip HK. Outcomes of combined mitochondria and mesenchymal stem cells-derived exosome therapy in rat acute respiratory distress syndrome and sepsis. World J Stem Cells 2024; 16(6): 690-707
- URL: https://www.wjgnet.com/1948-0210/full/v16/i6/690.htm
- DOI: https://dx.doi.org/10.4252/wjsc.v16.i6.690


