Copyright
©The Author(s) 2024.
World J Stem Cells. May 26, 2024; 16(5): 560-574
Published online May 26, 2024. doi: 10.4252/wjsc.v16.i5.560
Published online May 26, 2024. doi: 10.4252/wjsc.v16.i5.560
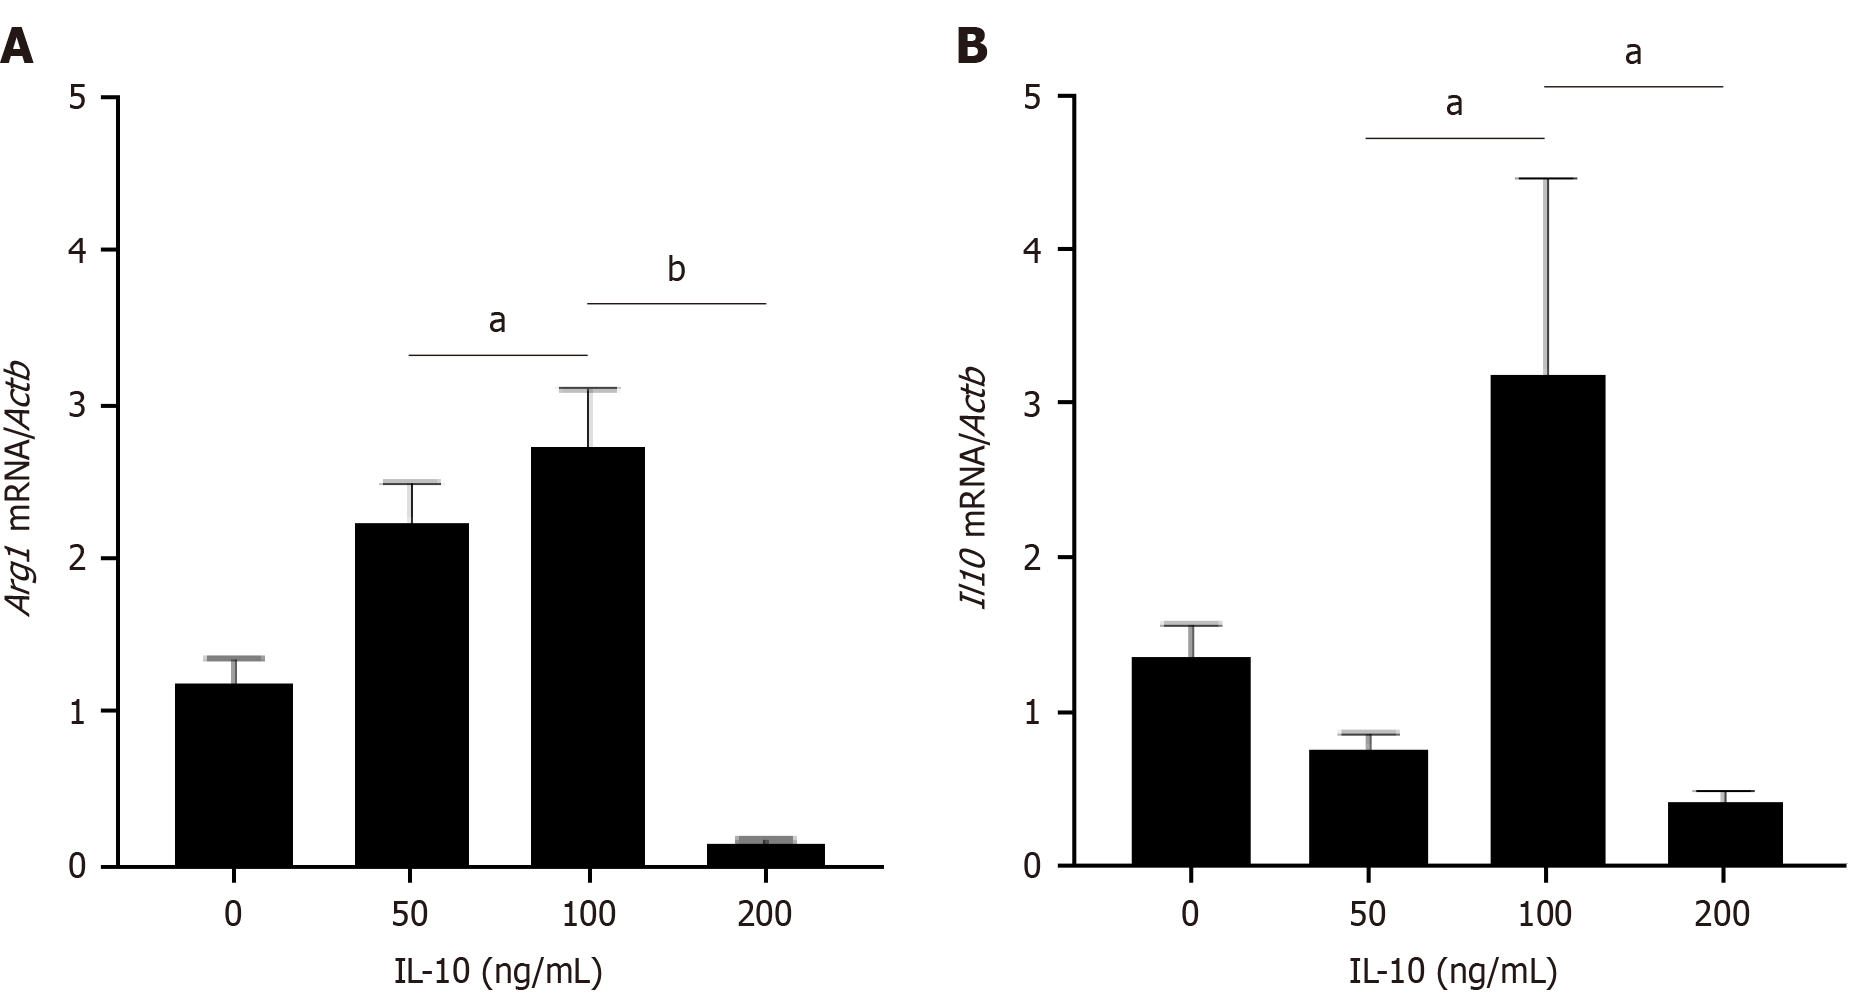
Figure 1 Expression of Arginase 1 and interleukin-10 in macrophages after stimulated by different concentrations of interleukin-10.
A: Real-time polymerase chain reaction (PCR) analysis of mRNA level of Arginase 1 (Arg1) in macrophages after stimulated by different concentrations of interleukin-10 (IL-10) (0, 50, 100, 200 ng/uL) for 24 h; B: Real-time PCR analysis of mRNA level of Il10 in macrophages (groups as above). The expression levels were normalized to the expression of β-actin (Actb). n = 3 biological replicates. Data are represented as mean ± SD, statistically significant difference at the levels as aP < 0.05 and bP < 0.01. Arg1: Arginase 1; IL-10: Interleukin-10; Actb: β-actin.
- Citation: Lyu MH, Bian C, Dou YP, Gao K, Xu JJ, Ma P. Effects of interleukin-10 treated macrophages on bone marrow mesenchymal stem cells via signal transducer and activator of transcription 3 pathway. World J Stem Cells 2024; 16(5): 560-574
- URL: https://www.wjgnet.com/1948-0210/full/v16/i5/560.htm
- DOI: https://dx.doi.org/10.4252/wjsc.v16.i5.560


