Copyright
©The Author(s) 2024.
World J Stem Cells. May 26, 2024; 16(5): 512-524
Published online May 26, 2024. doi: 10.4252/wjsc.v16.i5.512
Published online May 26, 2024. doi: 10.4252/wjsc.v16.i5.512
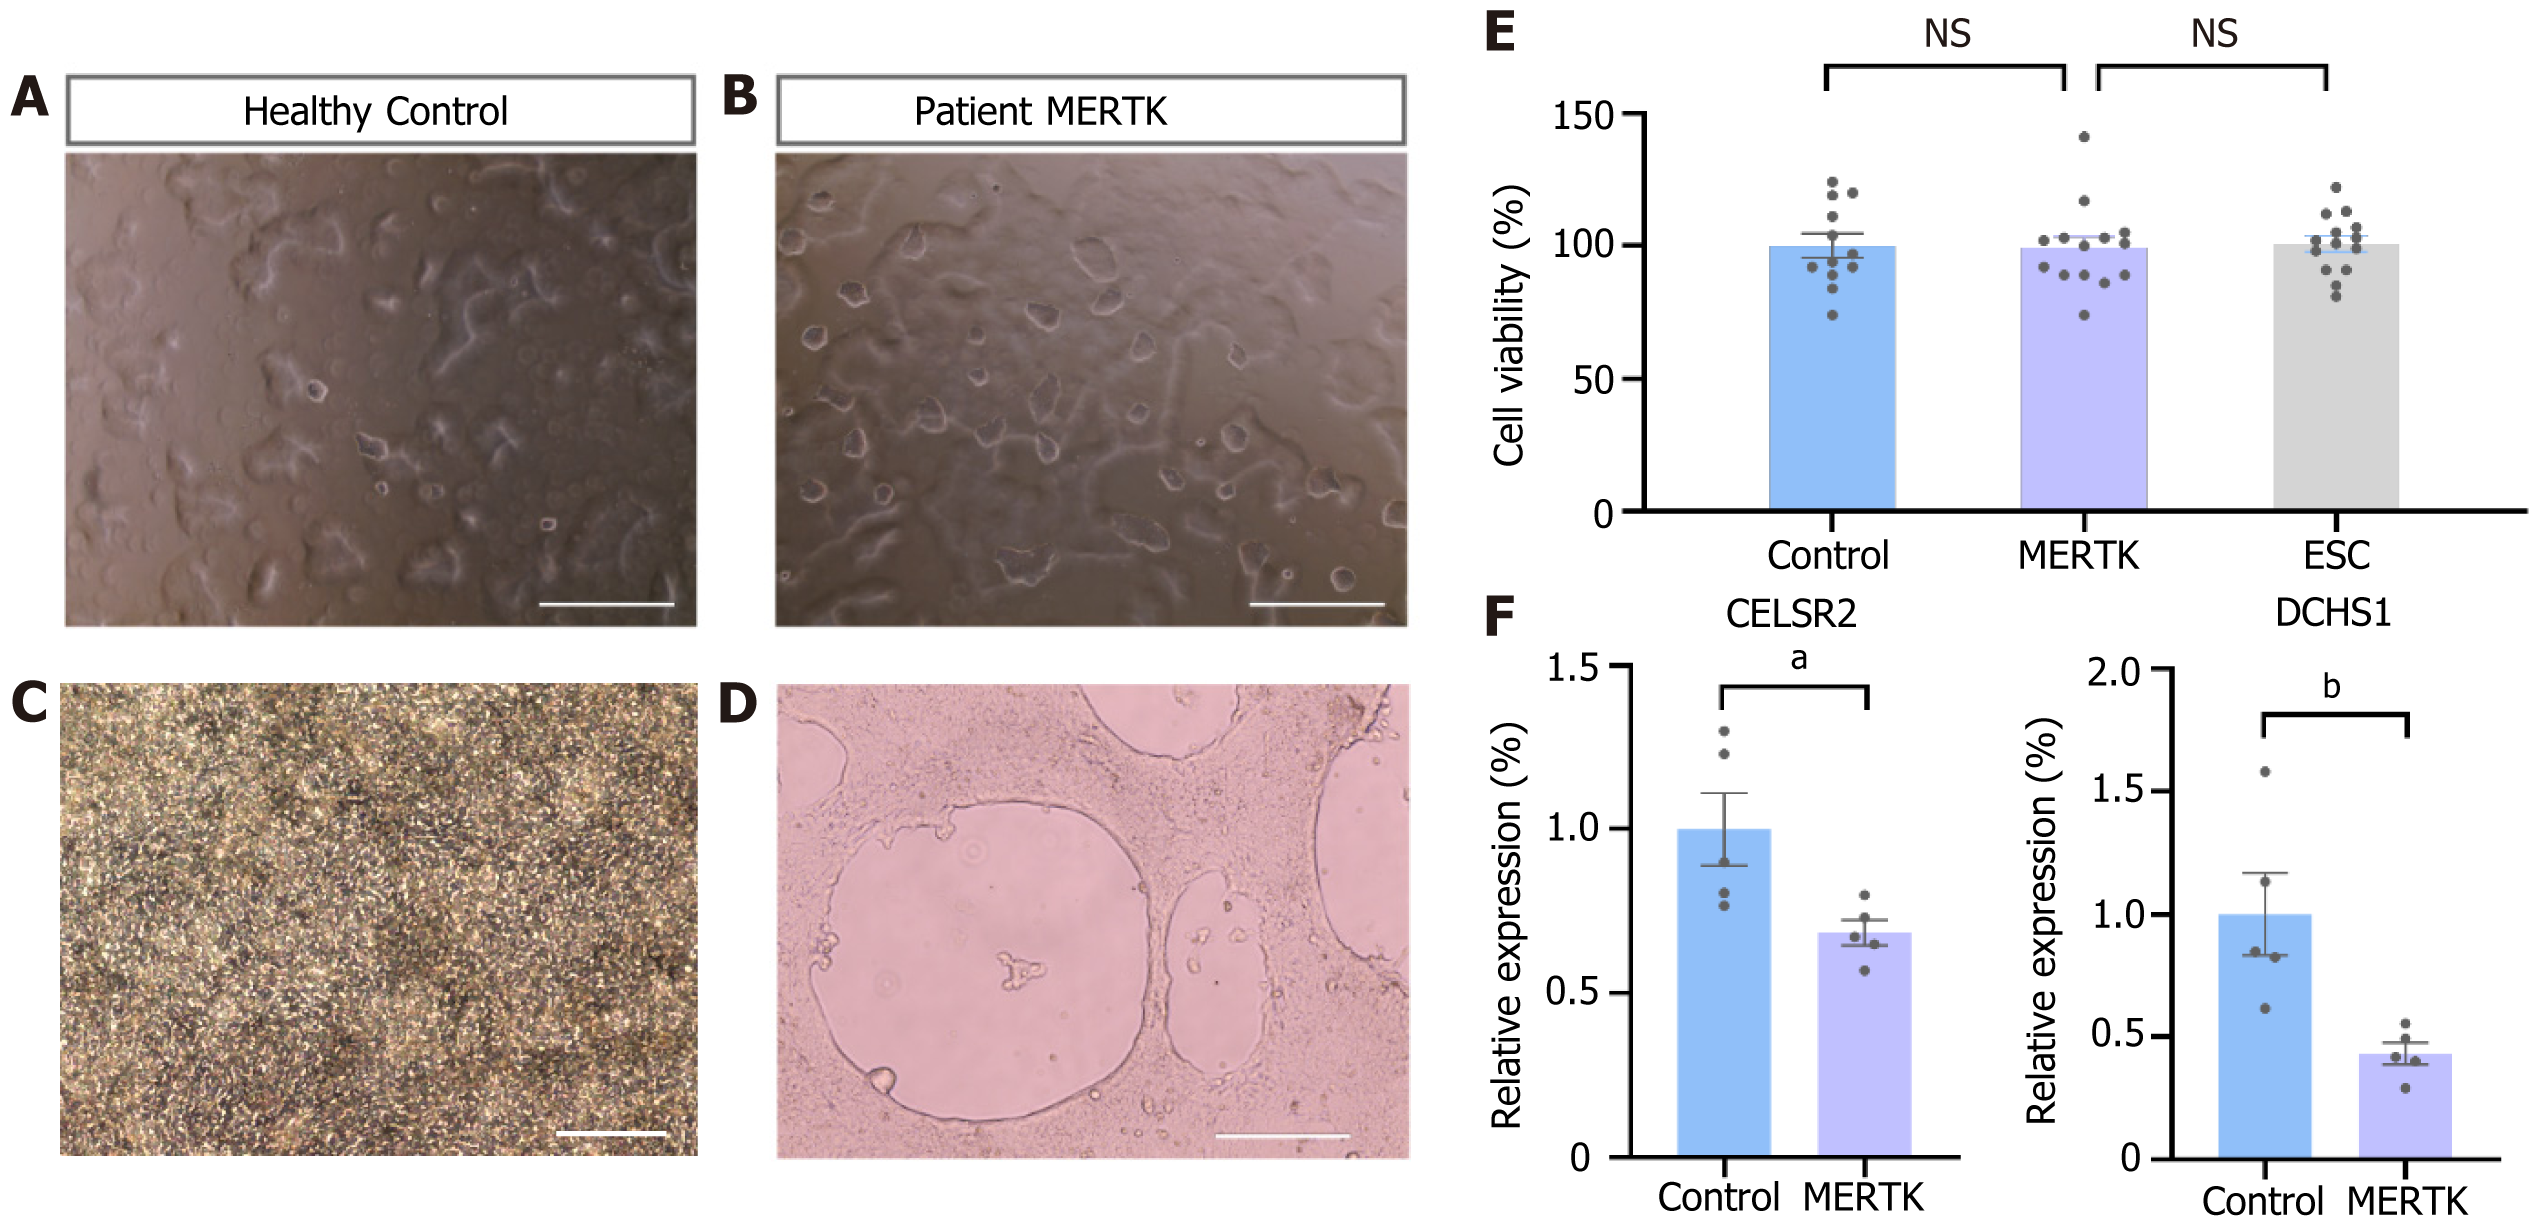
Figure 3 Abnormal adherent capability and aberrant differentiation potential.
A and B: Imaging of clones floating on the surface of the culture medium by phase-contrast microscopy. Scale bar = 1000 μm; C and D: Imaging of cells during epithelial cell differentiation. Scale bar = 200 μm (C), scale bar = 400 μm (D); E: Cell counting kit-8 detection of human induced pluripotent stem cell proliferation ability. mean ± SEM, n = 12-14; F: Quantitative polymerase chain reaction analysis of representative cadherin subfamily members CELSR2 and DCHS1. mean ± SEM, n = 5. Two-tailed t-test. aP < 0.05, bP < 0.05. NS: No significance. ESC: Embryonic stem cell.
- Citation: Zhang H, Wu LZ, Liu ZY, Jin ZB. Patient-derived induced pluripotent stem cells with a MERTK mutation exhibit cell junction abnormalities and aberrant cellular differentiation potential. World J Stem Cells 2024; 16(5): 512-524
- URL: https://www.wjgnet.com/1948-0210/full/v16/i5/512.htm
- DOI: https://dx.doi.org/10.4252/wjsc.v16.i5.512


