Copyright
©The Author(s) 2024.
World J Stem Cells. Feb 26, 2024; 16(2): 176-190
Published online Feb 26, 2024. doi: 10.4252/wjsc.v16.i2.176
Published online Feb 26, 2024. doi: 10.4252/wjsc.v16.i2.176
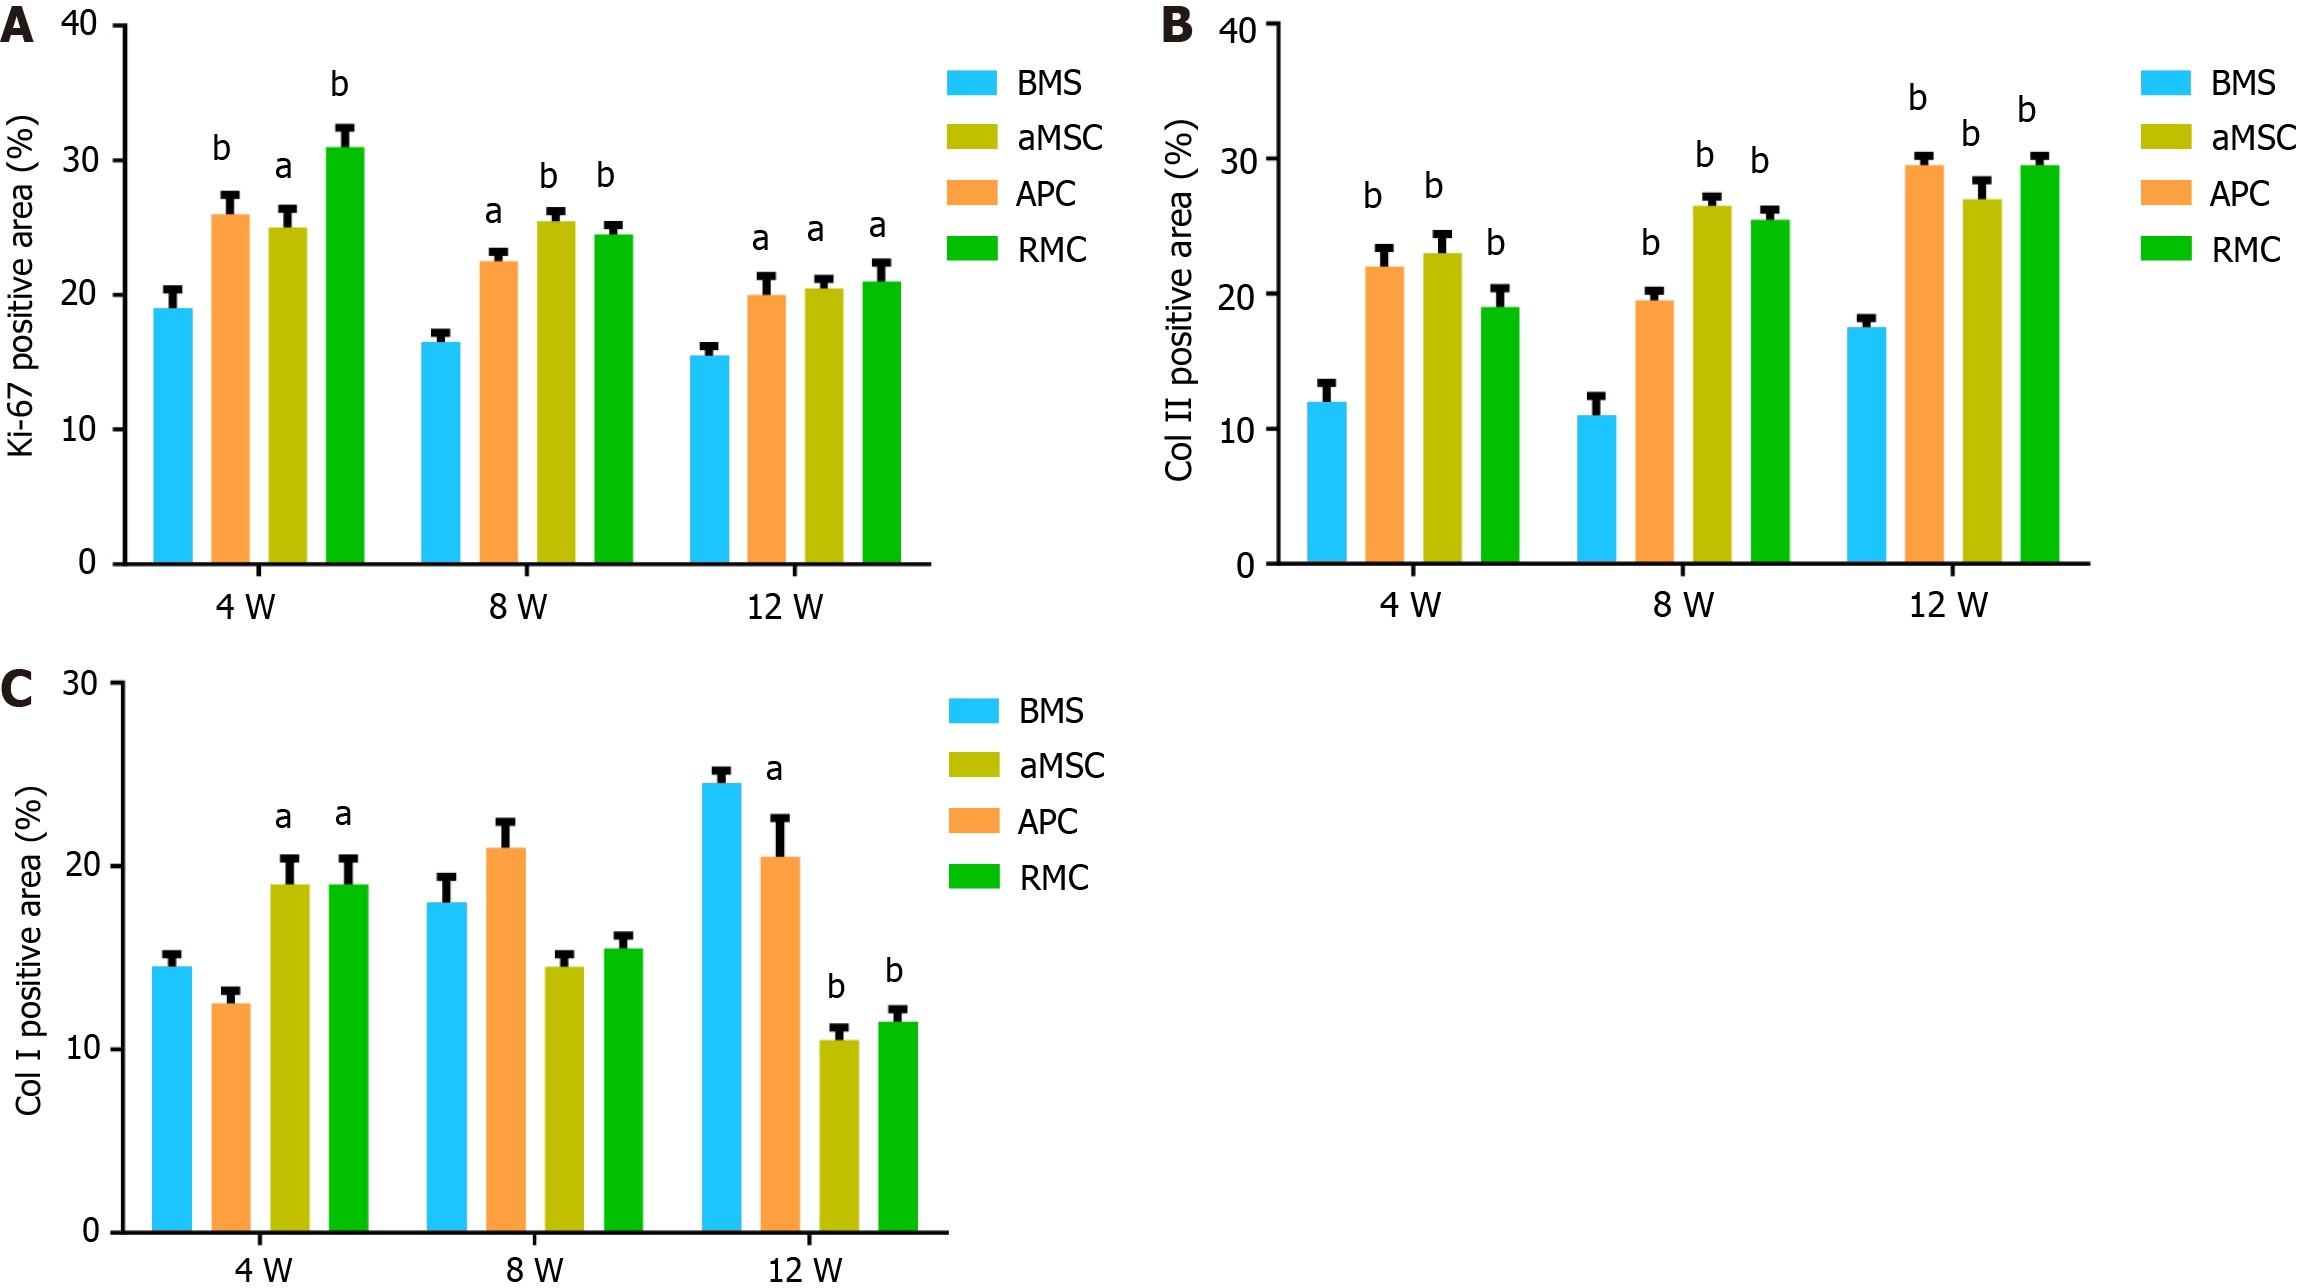
Figure 6 Quantification (%) of immunohistochemical positive staining.
A-C: The overall results were consistent with those of Figure 5. Ki-67 staining: The reserve mesenchymal cell (RMC) group was the highest at week 4, but gradually decreased over time; at weeks 8 and 12, three treatment groups reached lowest level, although all were still significantly higher than the control bone marrow stimulation (BMS) group, indicating that at week 12, the healing was almost complete. Col II staining: The BMS group was the lowest at 4, 8 and 12 wk, with the three treatment groups reaching a similar level at week 12, indicating that the treatment had greatly boosted cartilage formation. Col I staining: At week 4, the antlerogenic periosteal cell (APC) and RMC groups were significantly higher than the adipocyte-derived mesenchymal stromal cell (aMSC) and the control BMS groups, but at weeks 8 and 12 were significantly lower than that of the aMSC and the BMS groups; indicating that the two deer groups contained less bone or fibrous tissue. aP < 0.05; bP < 0.01. BMS: Bone marrow stimulation; aMSC: Adipocyte-derived mesenchymal stromal cell; APC: Antlerogenic periosteal cell; RMC: Antler reserve mesenchymal cell.
- Citation: Wang YS, Chu WH, Zhai JJ, Wang WY, He ZM, Zhao QM, Li CY. High quality repair of osteochondral defects in rats using the extracellular matrix of antler stem cells. World J Stem Cells 2024; 16(2): 176-190
- URL: https://www.wjgnet.com/1948-0210/full/v16/i2/176.htm
- DOI: https://dx.doi.org/10.4252/wjsc.v16.i2.176


