Copyright
©The Author(s) 2023.
World J Stem Cells. Aug 26, 2023; 15(8): 821-841
Published online Aug 26, 2023. doi: 10.4252/wjsc.v15.i8.821
Published online Aug 26, 2023. doi: 10.4252/wjsc.v15.i8.821
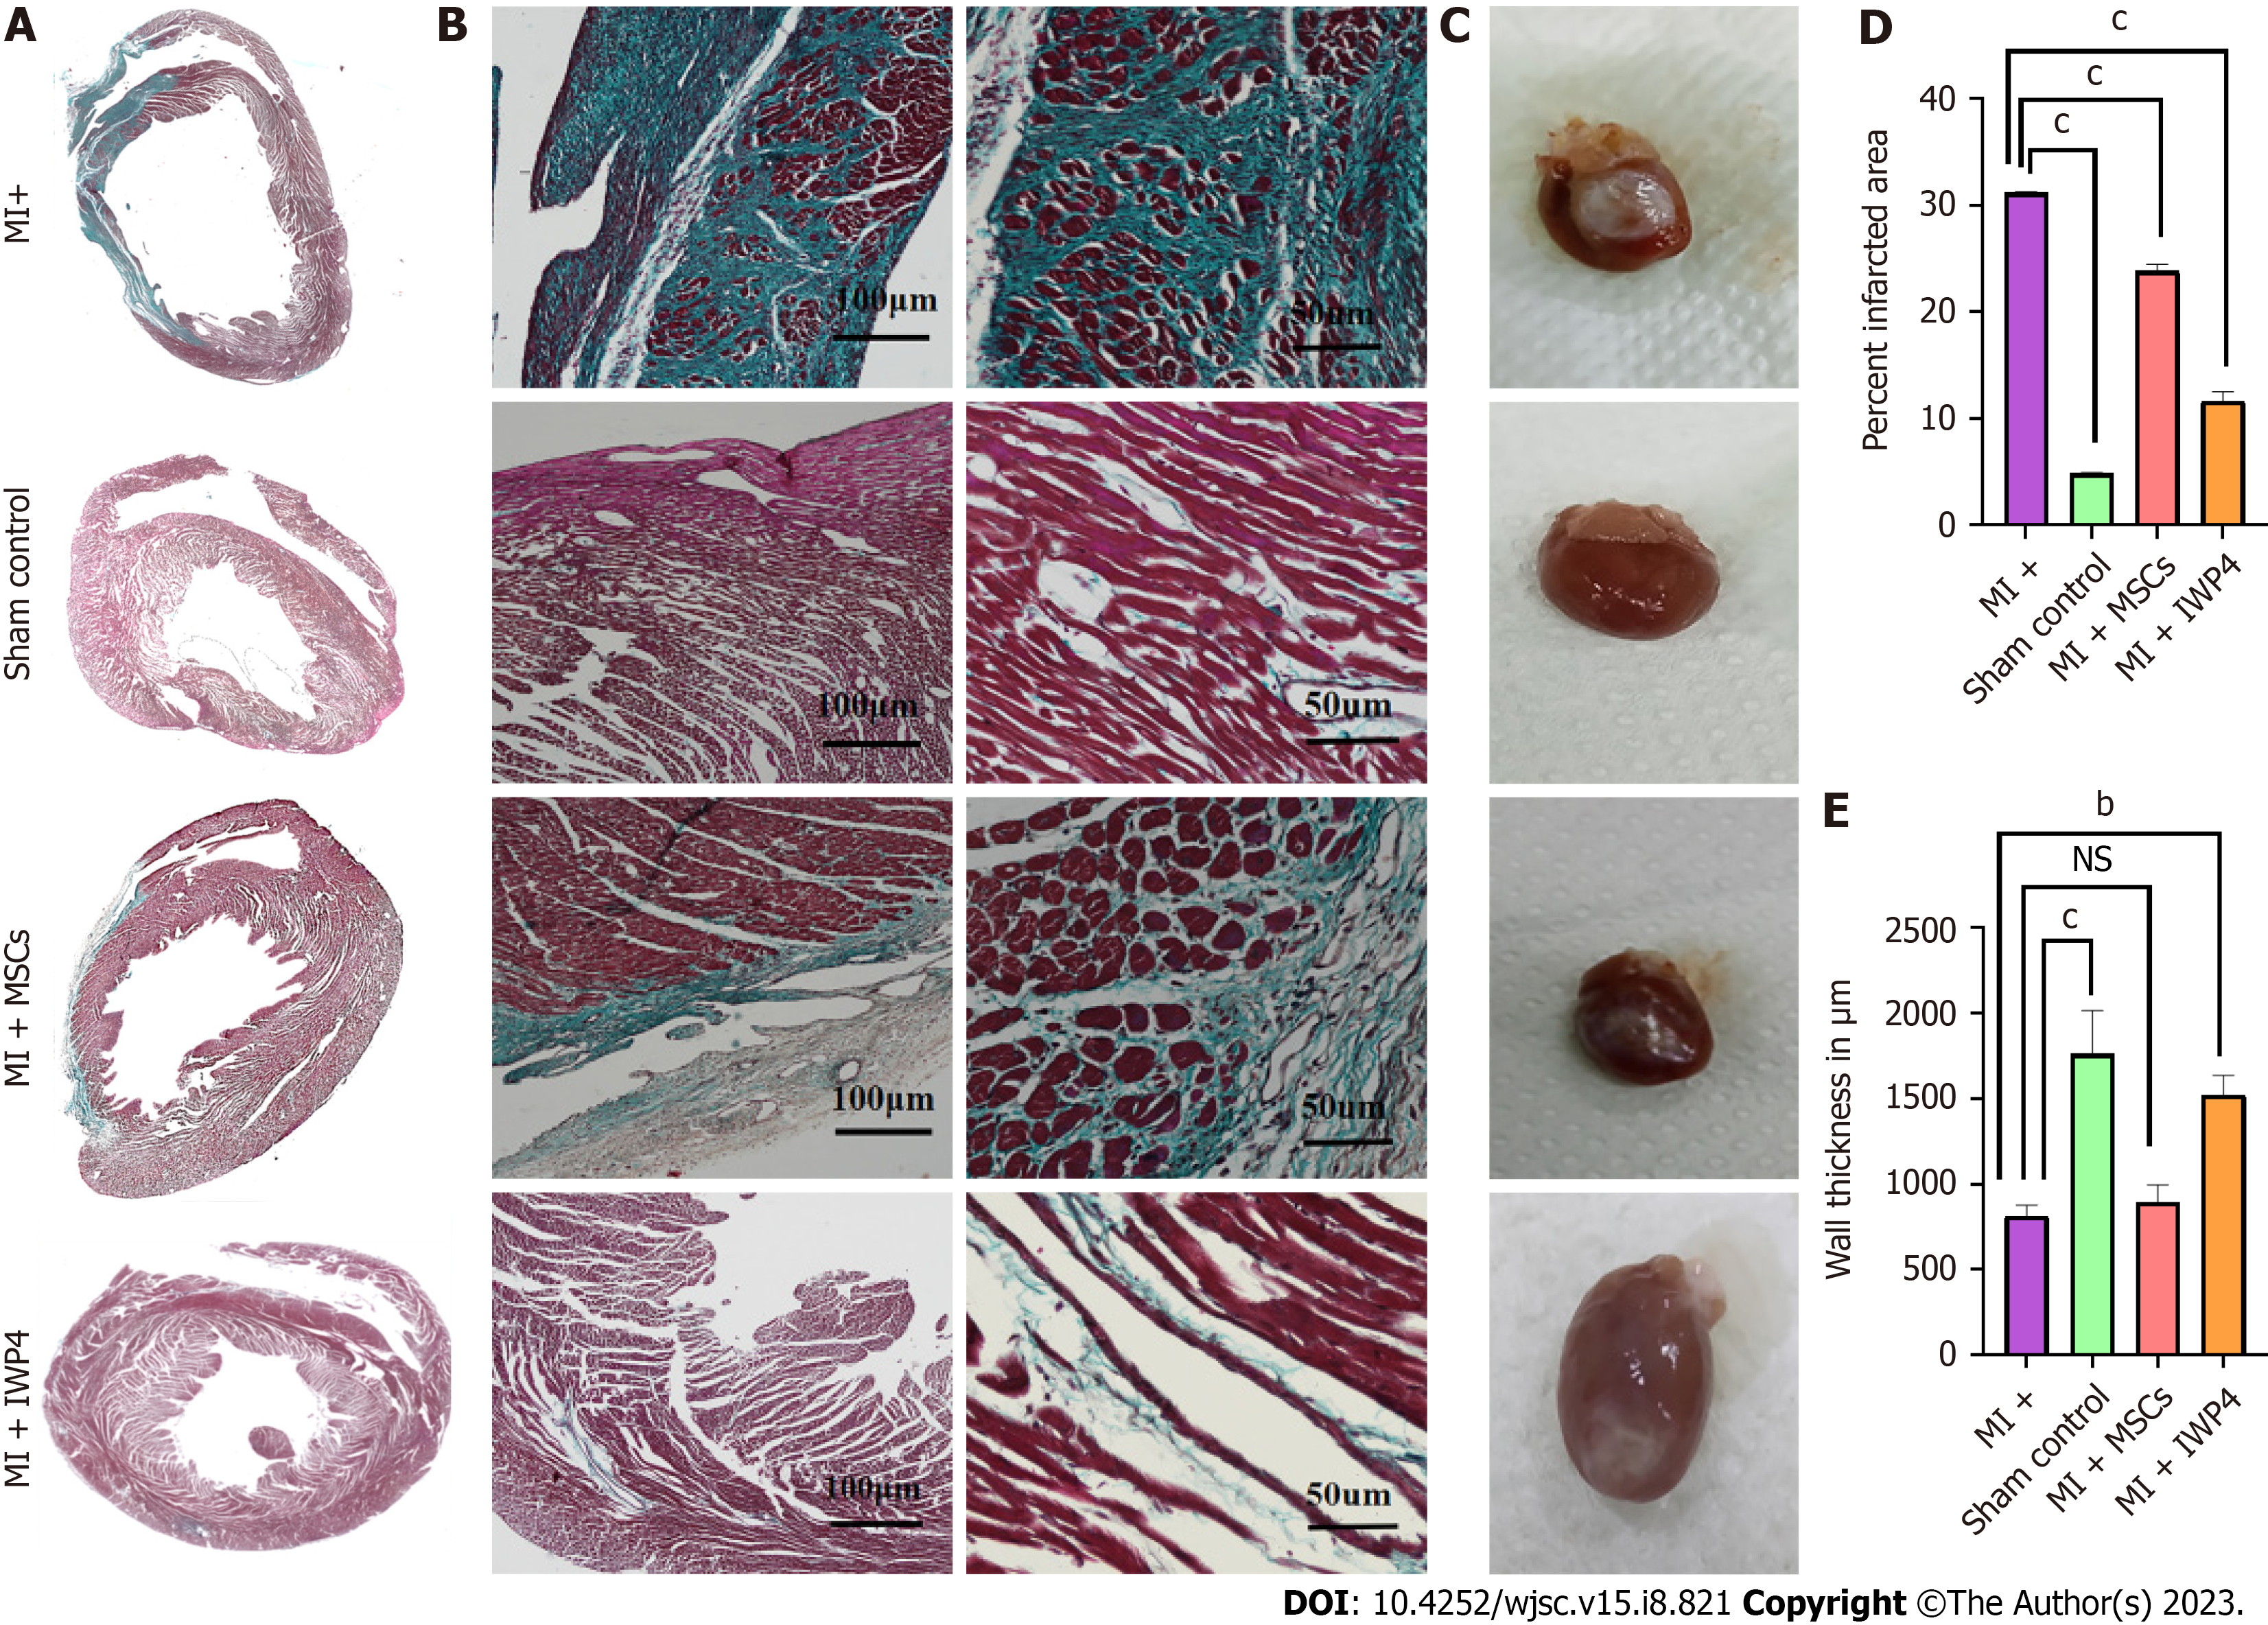
Figure 7 Histological analysis of heart sections.
A: Large scan images showing Masson’s trichrome stained transverse section of the whole heart; B: Magnified images showing Masson’s trichrome stained sections in sham control, myocardial infarction (MI+), mesenchymal stem cells (MSCs) (MI+MSCs), and inhibitor Wnt production-4 (IWP-4) treated MSCs (MI+IWP-4) groups after 4 wk of MI; C: Images showing isolated rat hearts of sham control, MI+ group, MI+MSC group, and MI+IWP-4 groups; D: Bar graph showing percent infarcted area as compared to MI+ group. Percent infarcted area was significantly decreased in MI+MSC and MI+IWP-4 groups after 4 wk of MI; E: Bar graph showing left ventricular wall thickness as compared to MI+ group; left ventricular wall thickness was non-significant in MI+MSC group and significantly increased in the MI+IWP-4 group after 4 wk of MI. For statistical analysis, One-way ANOVA was used followed by the Bonferroni post-hoc test. Data is presented as mean ± SEM with significance level P < 0.05 where (bP < 0.01, cP < 0.001). IWP-4: Inhibitor Wnt production-4; MSC: Mesenchymal stem cell; MI: Myocardial infarction; NS: No significant.
- Citation: Muneer R, Qazi REM, Fatima A, Ahmad W, Salim A, Dini L, Khan I. Wnt signaling pathway inhibitor promotes mesenchymal stem cells differentiation into cardiac progenitor cells in vitro and improves cardiomyopathy in vivo. World J Stem Cells 2023; 15(8): 821-841
- URL: https://www.wjgnet.com/1948-0210/full/v15/i8/821.htm
- DOI: https://dx.doi.org/10.4252/wjsc.v15.i8.821


