Copyright
©The Author(s) 2023.
World J Stem Cells. Jun 26, 2023; 15(6): 589-606
Published online Jun 26, 2023. doi: 10.4252/wjsc.v15.i6.589
Published online Jun 26, 2023. doi: 10.4252/wjsc.v15.i6.589
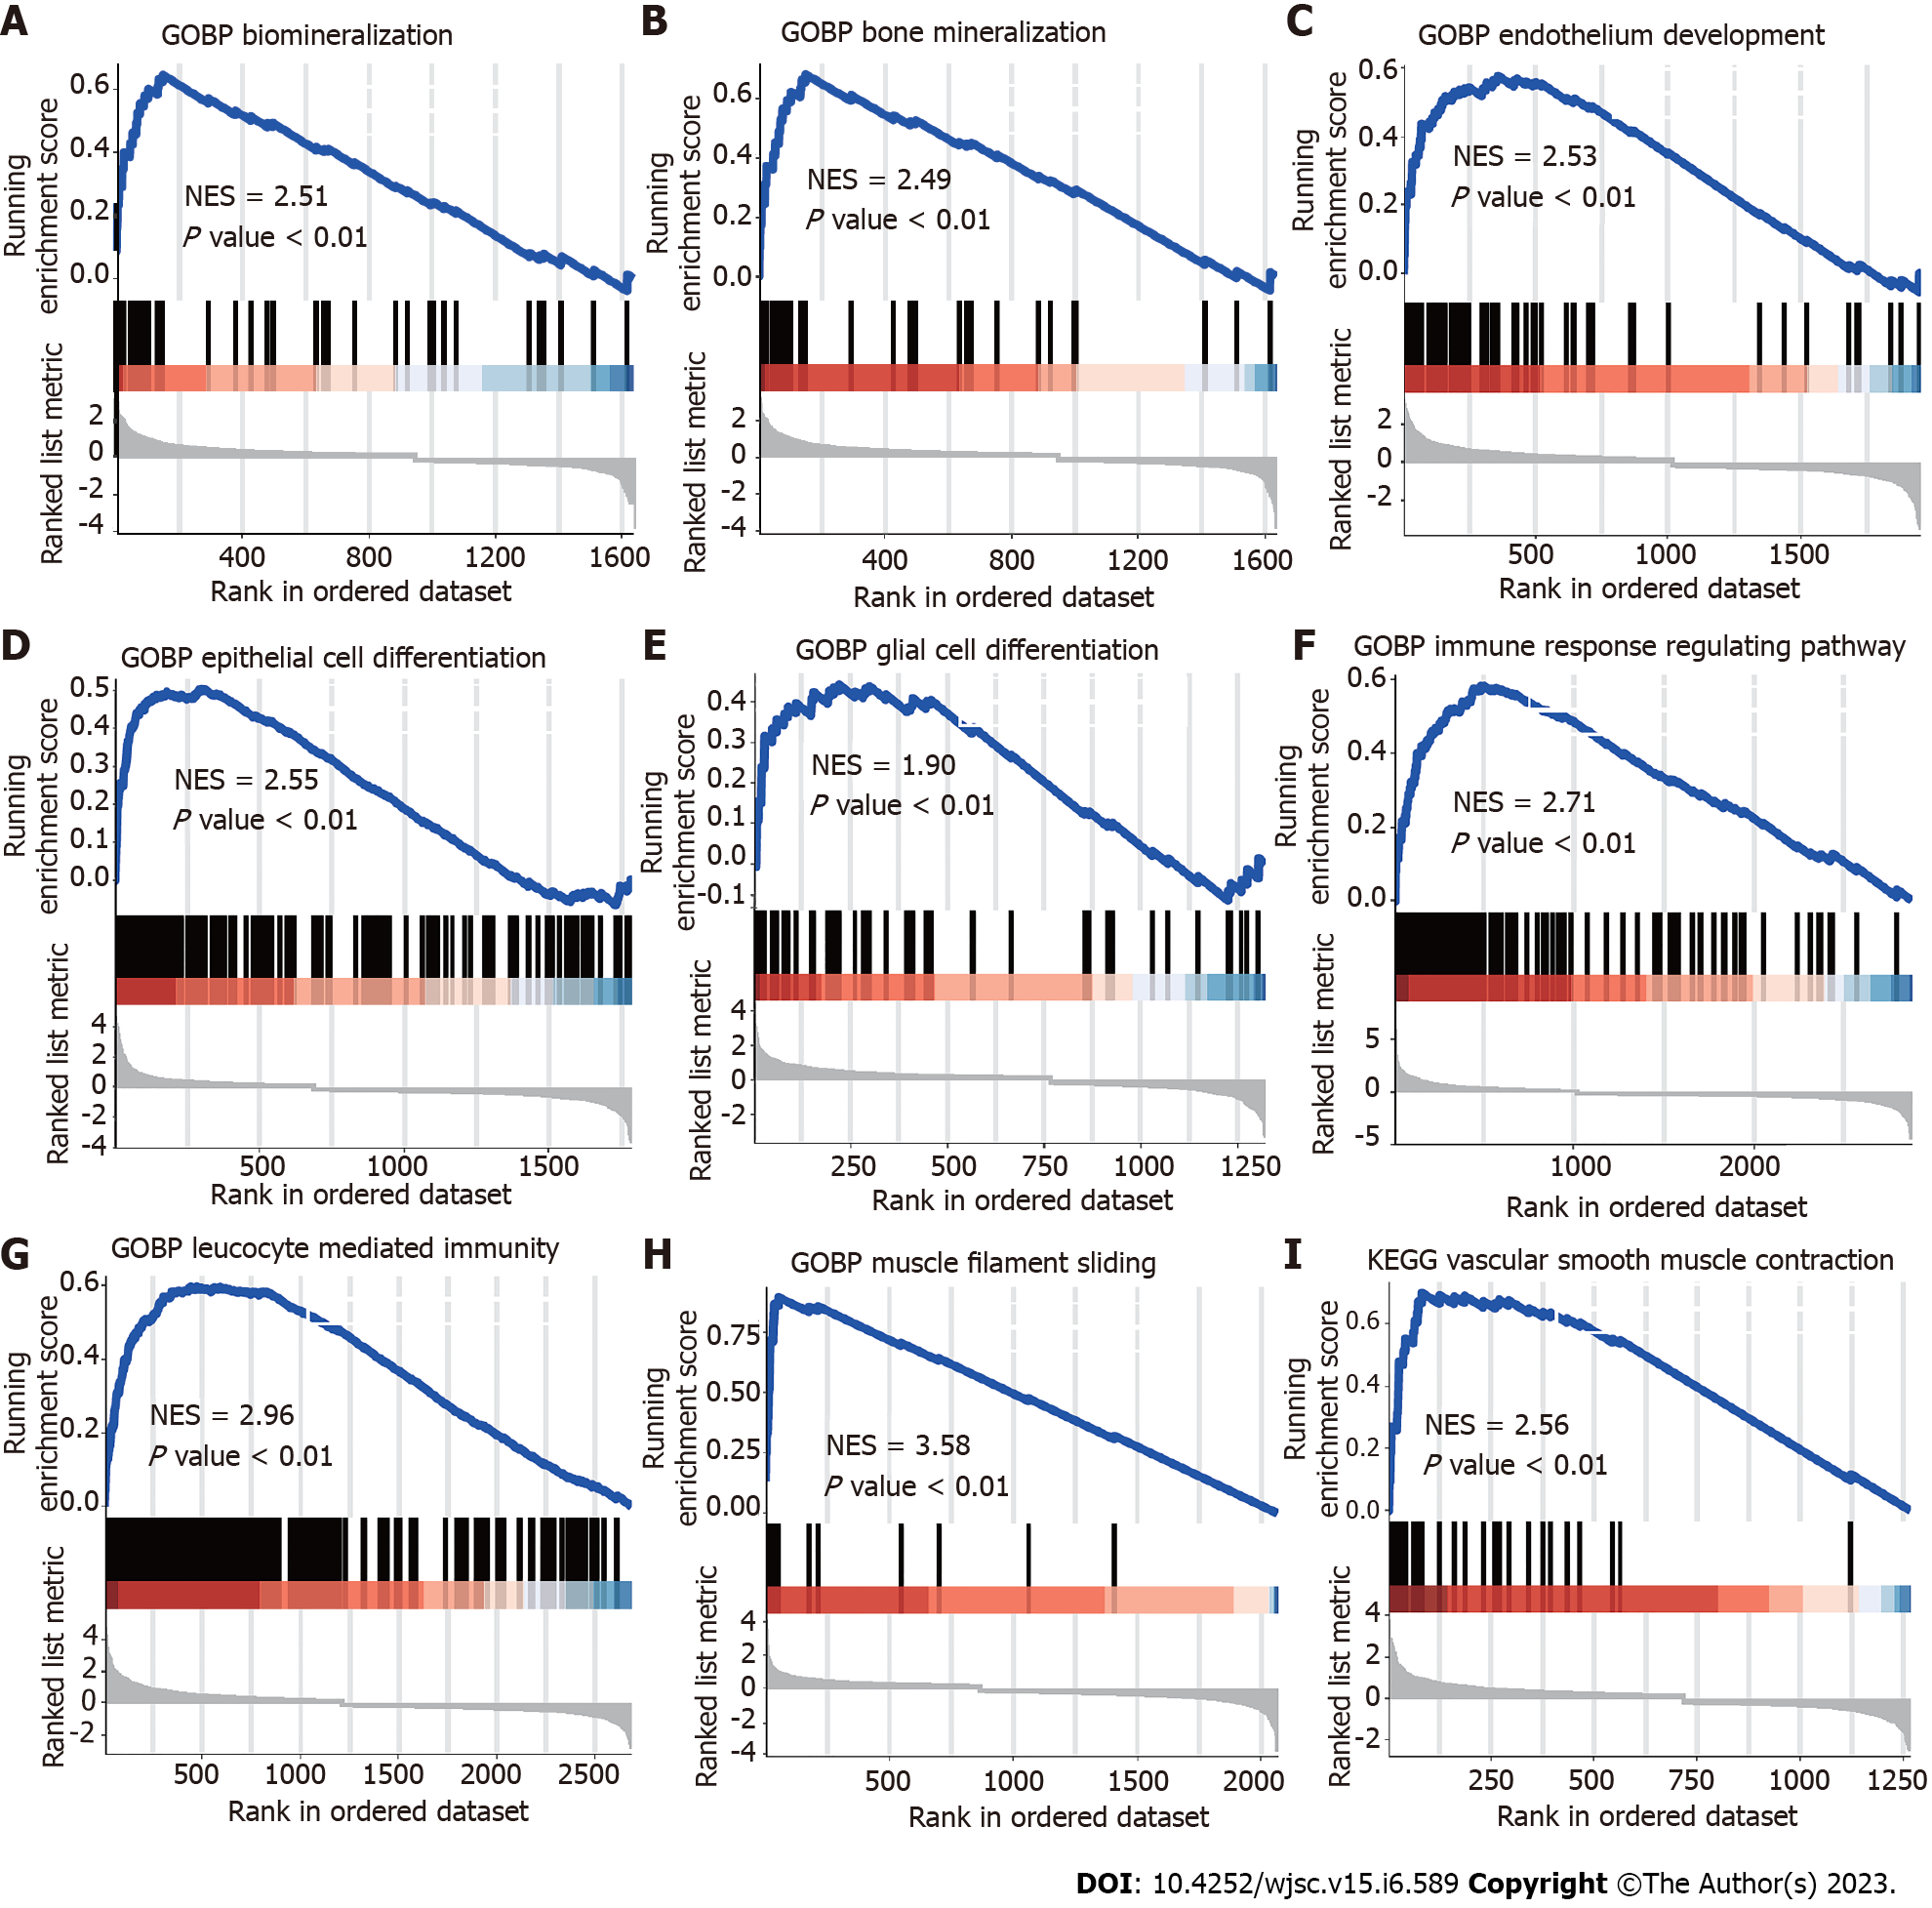
Figure 2 Gene set enrichment analysis plots for representative signaling pathways upregulated in maxillary process.
Gene set enrichment analysis enriched differentially expressed genes into multifunctional gene networks. A and B: Representative gene set enrichment analysis maps for mesenchymal stem cells; C: Endothelial cells; D: Epithelial cells; E: Glia; F: T cells; G: Macrophages; H: Muscle cells; I: Perivascular cells. Normalized enrichment score normalized enrichment score, corrected for multiple comparisons using false discovery rate method, P values shown in plots. NES: Normalized enrichment score.
- Citation: Zhang YY, Li F, Zeng XK, Zou YH, Zhu BB, Ye JJ, Zhang YX, Jin Q, Nie X. Single cell RNA sequencing reveals mesenchymal heterogeneity and critical functions of Cd271 in tooth development. World J Stem Cells 2023; 15(6): 589-606
- URL: https://www.wjgnet.com/1948-0210/full/v15/i6/589.htm
- DOI: https://dx.doi.org/10.4252/wjsc.v15.i6.589


