Copyright
©The Author(s) 2023.
World J Stem Cells. Apr 26, 2023; 15(4): 268-280
Published online Apr 26, 2023. doi: 10.4252/wjsc.v15.i4.268
Published online Apr 26, 2023. doi: 10.4252/wjsc.v15.i4.268
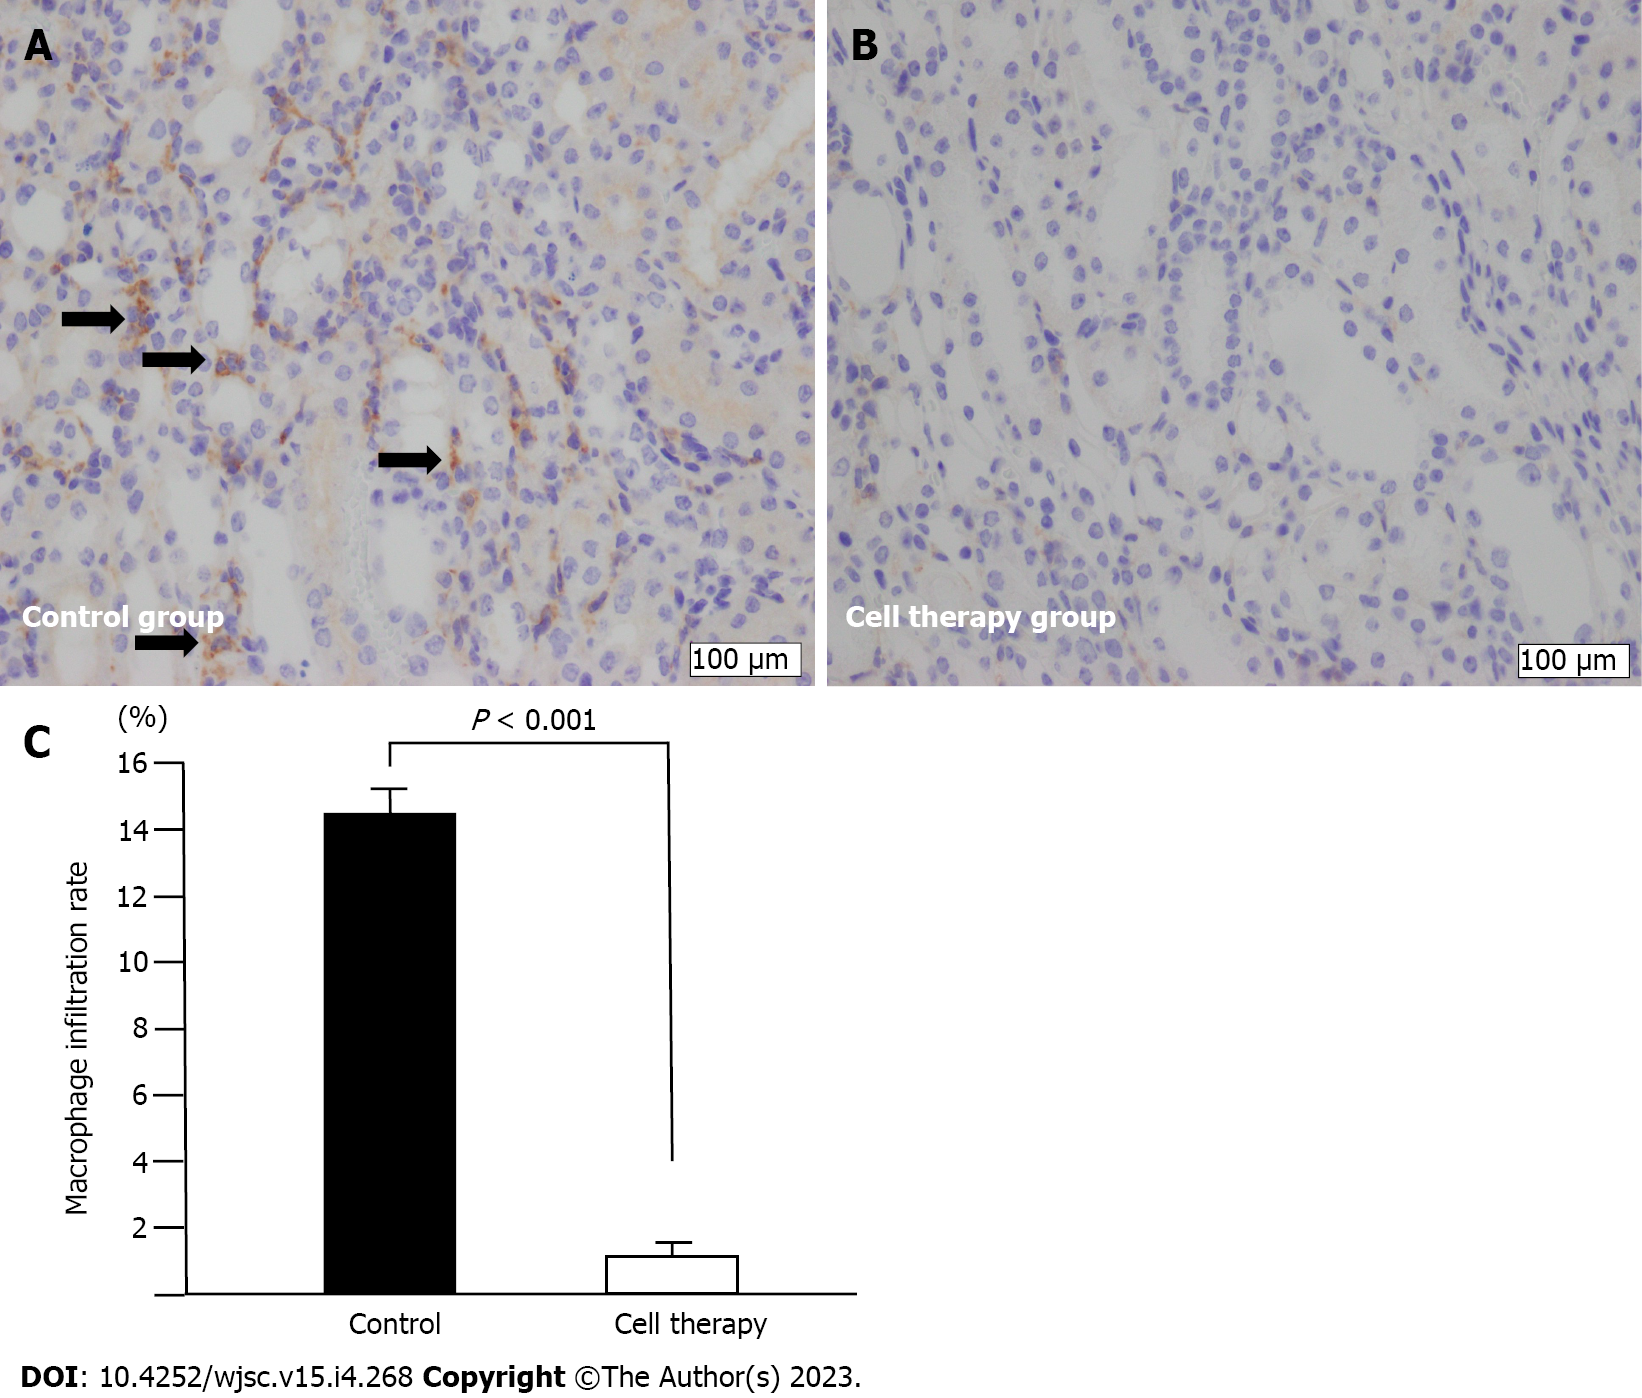
Figure 6 Macrophage infiltration analysis.
A and B: F4/80+ macrophage immunostaining (arrows) in control group (A) and cell therapy group (B); original magnification (× 400). Scale bar: 100 μm; C: Quantitative analysis of the rate of macrophage infiltration area. Statistical significance in Figure 6C was determined using Mann-Whitney U test.
- Citation: Ohtake T, Itaba S, Salybekov AA, Sheng Y, Sato T, Yanai M, Imagawa M, Fujii S, Kumagai H, Harata M, Asahara T, Kobayashi S. Repetitive administration of cultured human CD34+ cells improve adenine-induced kidney injury in mice. World J Stem Cells 2023; 15(4): 268-280
- URL: https://www.wjgnet.com/1948-0210/full/v15/i4/268.htm
- DOI: https://dx.doi.org/10.4252/wjsc.v15.i4.268


