Copyright
©The Author(s) 2023.
World J Stem Cells. Apr 26, 2023; 15(4): 268-280
Published online Apr 26, 2023. doi: 10.4252/wjsc.v15.i4.268
Published online Apr 26, 2023. doi: 10.4252/wjsc.v15.i4.268
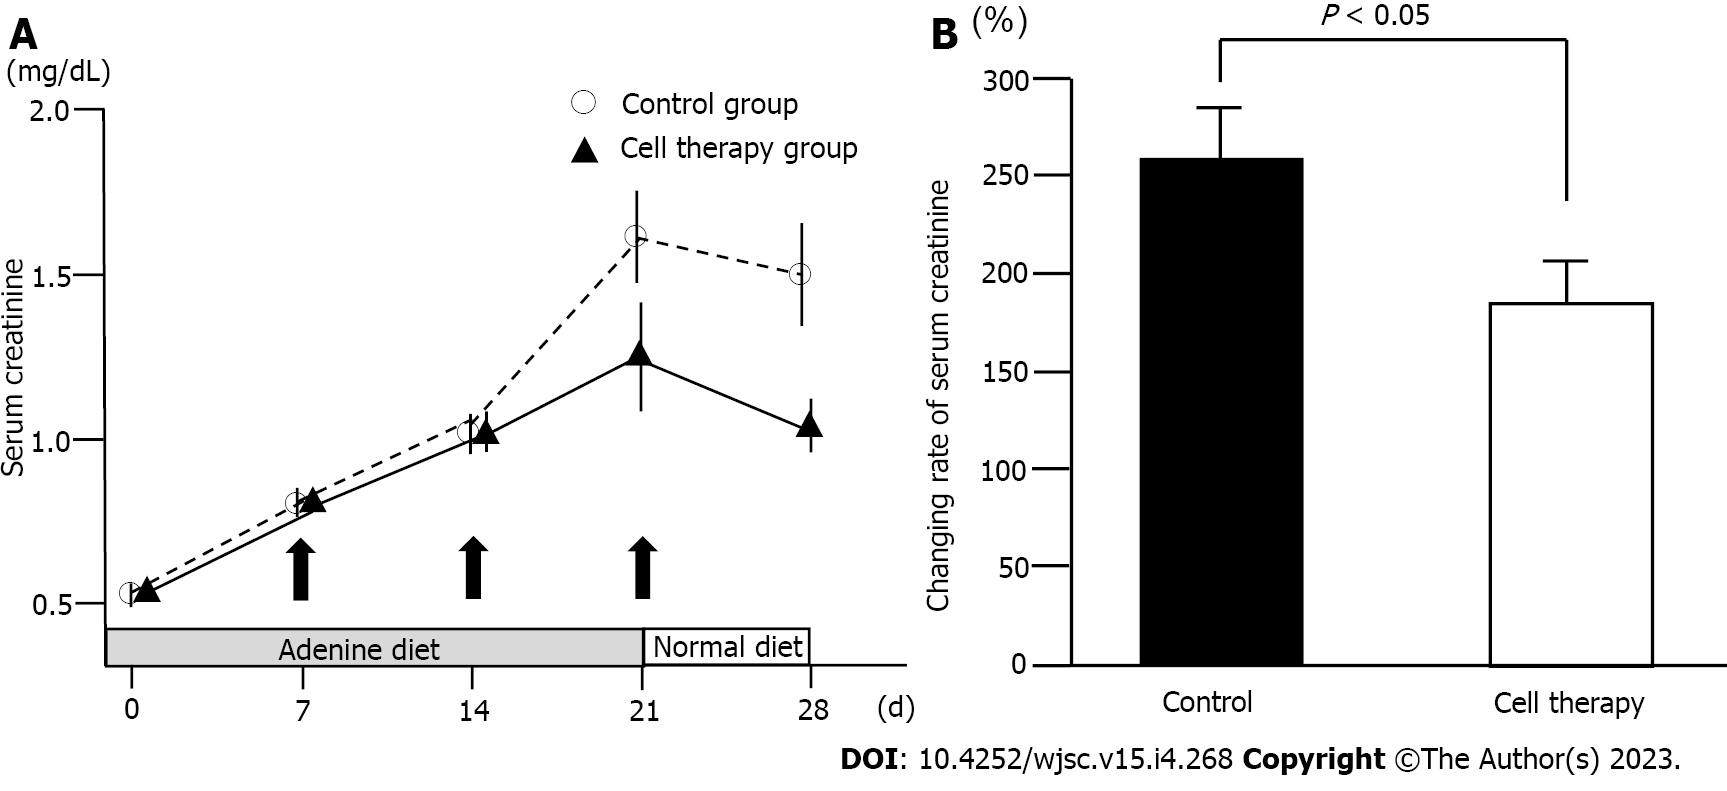
Figure 3 Changes in serum creatinine levels.
A: Time-course of serum creatinine levels in the control group (n = 17) and cell therapy group (n = 18). The P value between the control group and the cell therapy group on day 28 was 0.06; B: Change rate of serum creatinine levels from baseline to day 28 in the control and cell therapy groups. Statistical significance in Figure 3A was determined using repeated measures analysis of variance. Statistical significance in Figure 3B was determined using Mann-Whitney U test.
- Citation: Ohtake T, Itaba S, Salybekov AA, Sheng Y, Sato T, Yanai M, Imagawa M, Fujii S, Kumagai H, Harata M, Asahara T, Kobayashi S. Repetitive administration of cultured human CD34+ cells improve adenine-induced kidney injury in mice. World J Stem Cells 2023; 15(4): 268-280
- URL: https://www.wjgnet.com/1948-0210/full/v15/i4/268.htm
- DOI: https://dx.doi.org/10.4252/wjsc.v15.i4.268


