Copyright
©The Author(s) 2022.
World J Stem Cells. Sep 26, 2022; 14(9): 729-743
Published online Sep 26, 2022. doi: 10.4252/wjsc.v14.i9.729
Published online Sep 26, 2022. doi: 10.4252/wjsc.v14.i9.729
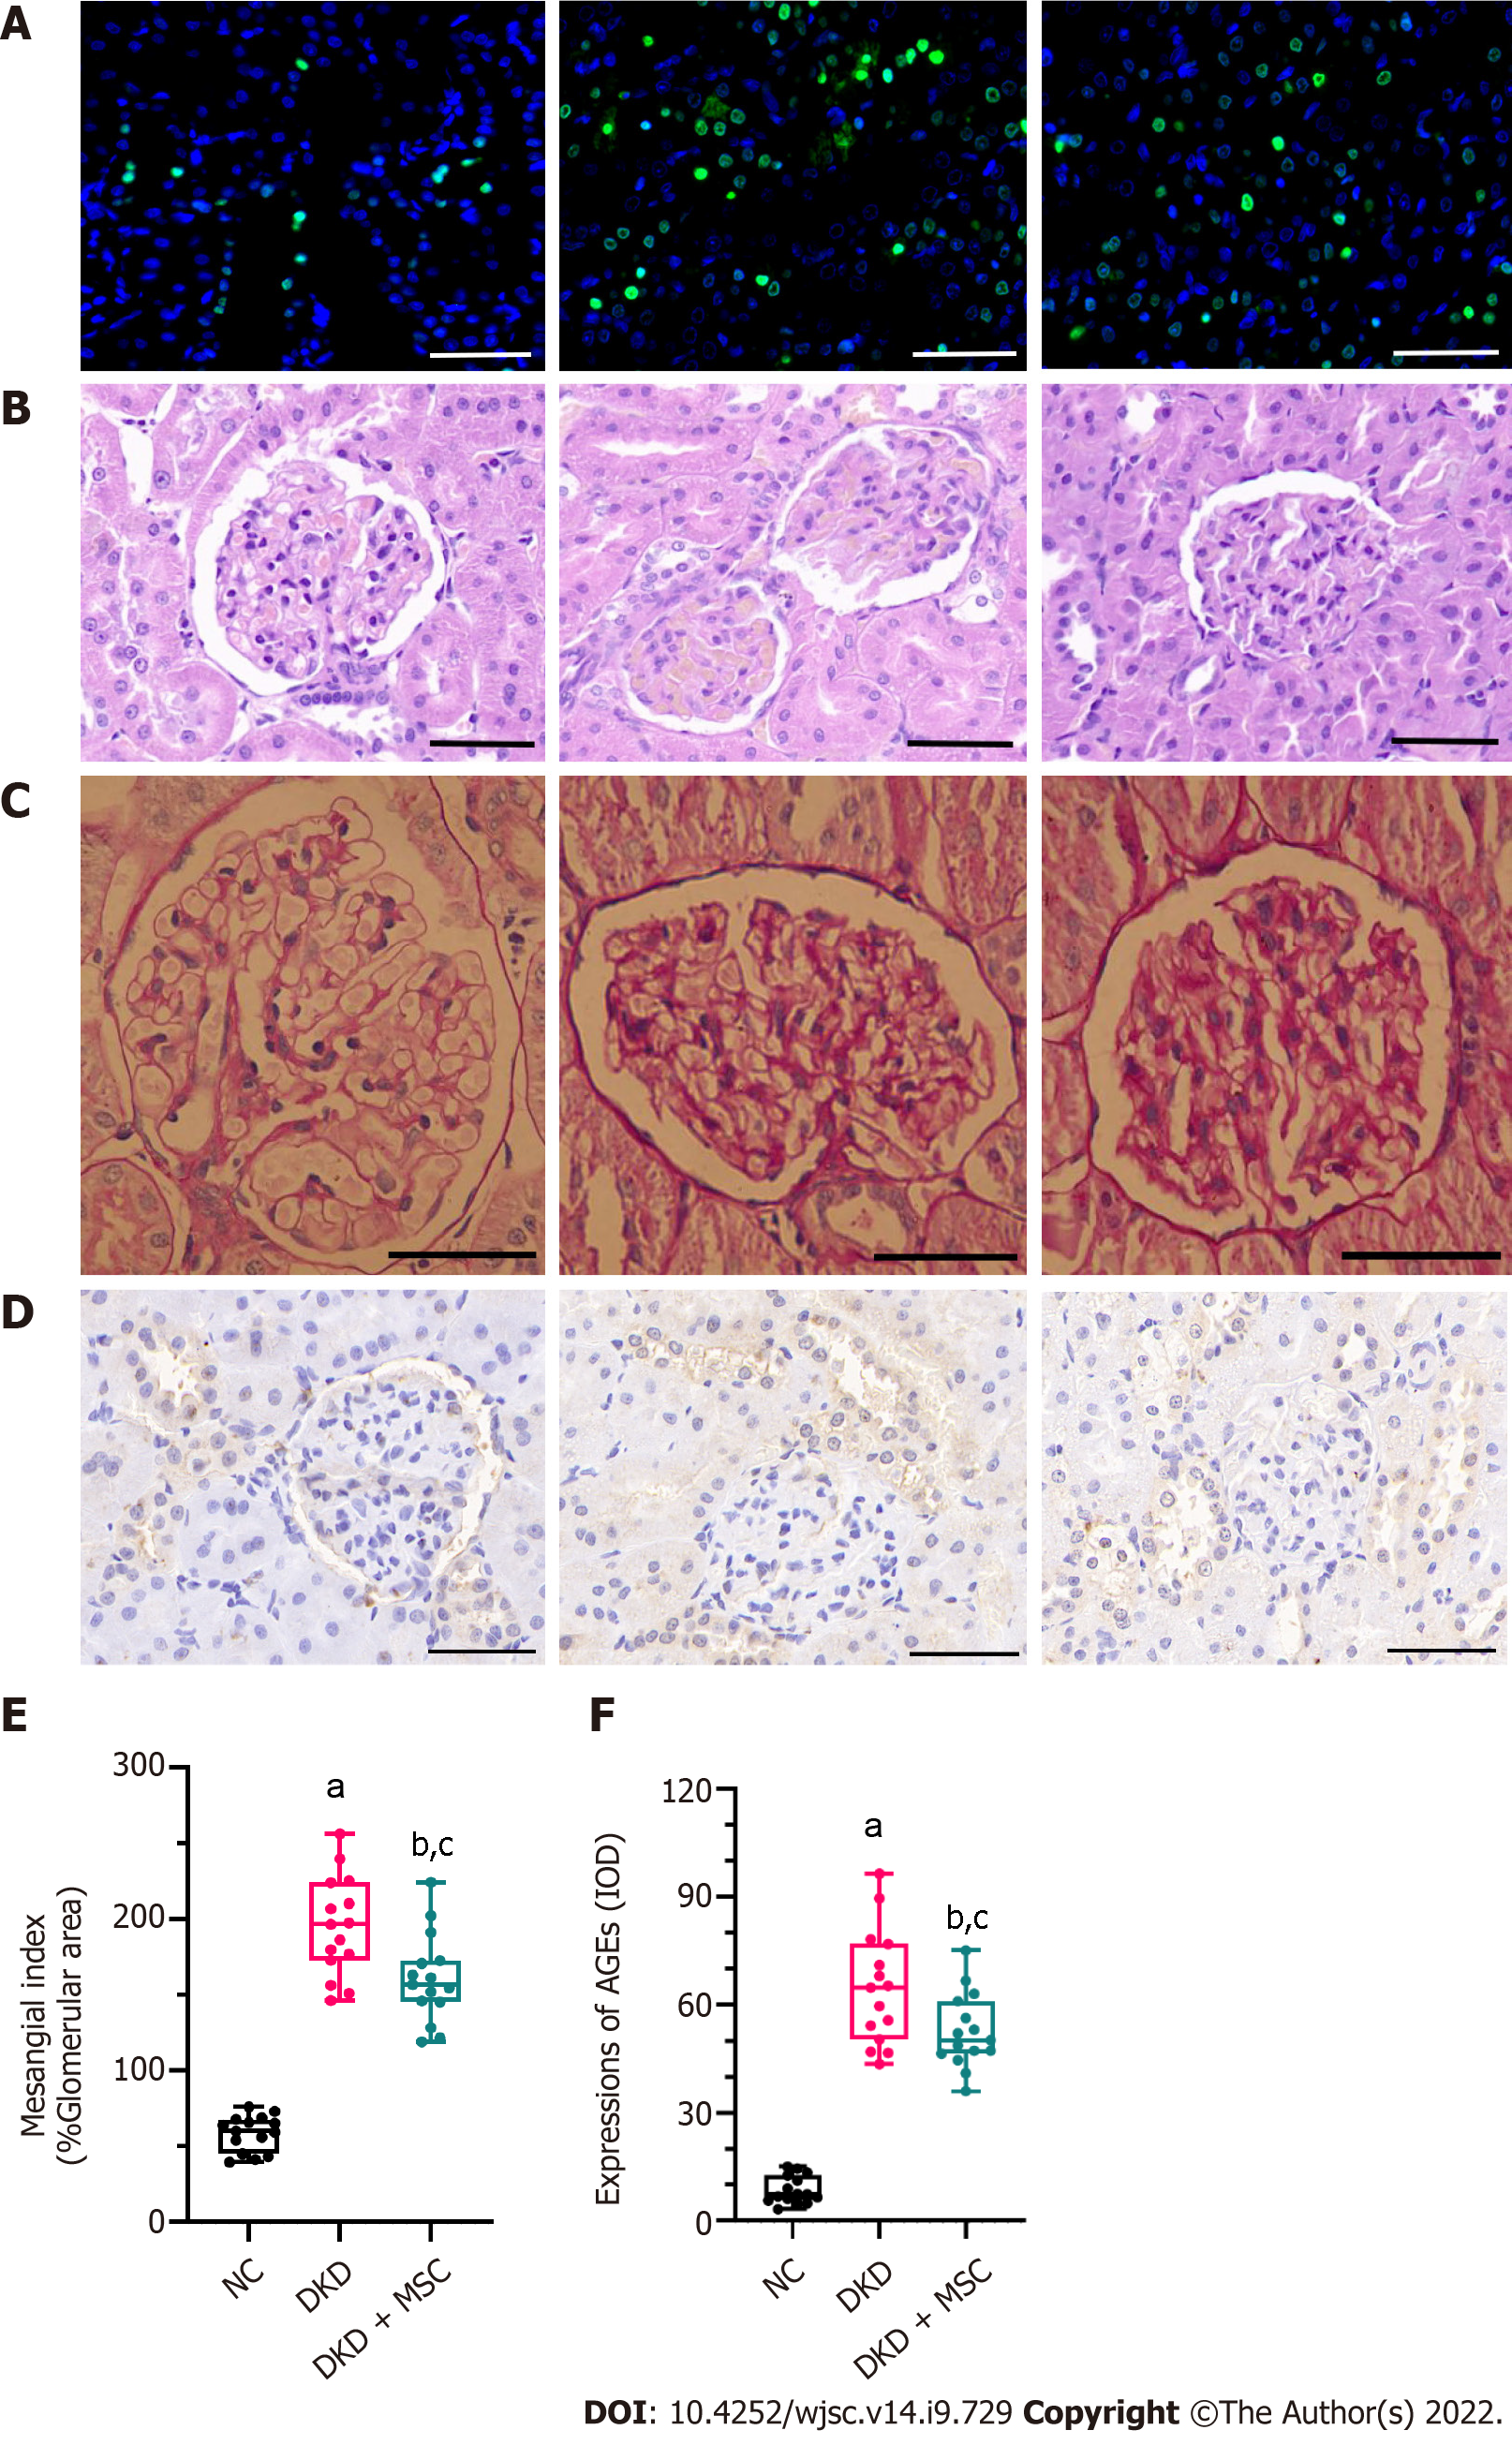
Figure 4 TdT-mediated dUTP nick-end labeling and histopathology analysis of kidney tissues from all rats.
A: TdT-mediated dUTP nick-end labeling staining. Nuclei: Blue; apoptosis: Green; B: Hematoxylin-eosin staining; C: Periodic acid-Schiff (PAS) staining; D: Mesangial index of PAS-positive areas in the glomerulus; E: Immunohistochemical staining of advanced glycation end products (AGEs); F: Integrated optical density of AGEs in kidney tissues. All scale bar: 50 μm. Data are presented as the mean ± SD. aP < 0.001 vs normal control group, bP < 0.001 vs normal control group, cP < 0.05 vs diabetic kidney disease group. AGEs: Advanced glycation end products; NC: Normal control; DKD: Diabetic kidney disease; MSCs: Mesenchymal stem cells.
- Citation: Tang LX, Wei B, Jiang LY, Ying YY, Li K, Chen TX, Huang RF, Shi MJ, Xu H. Intercellular mitochondrial transfer as a means of revitalizing injured glomerular endothelial cells. World J Stem Cells 2022; 14(9): 729-743
- URL: https://www.wjgnet.com/1948-0210/full/v14/i9/729.htm
- DOI: https://dx.doi.org/10.4252/wjsc.v14.i9.729


