Copyright
©The Author(s) 2022.
World J Stem Cells. Sep 26, 2022; 14(9): 729-743
Published online Sep 26, 2022. doi: 10.4252/wjsc.v14.i9.729
Published online Sep 26, 2022. doi: 10.4252/wjsc.v14.i9.729
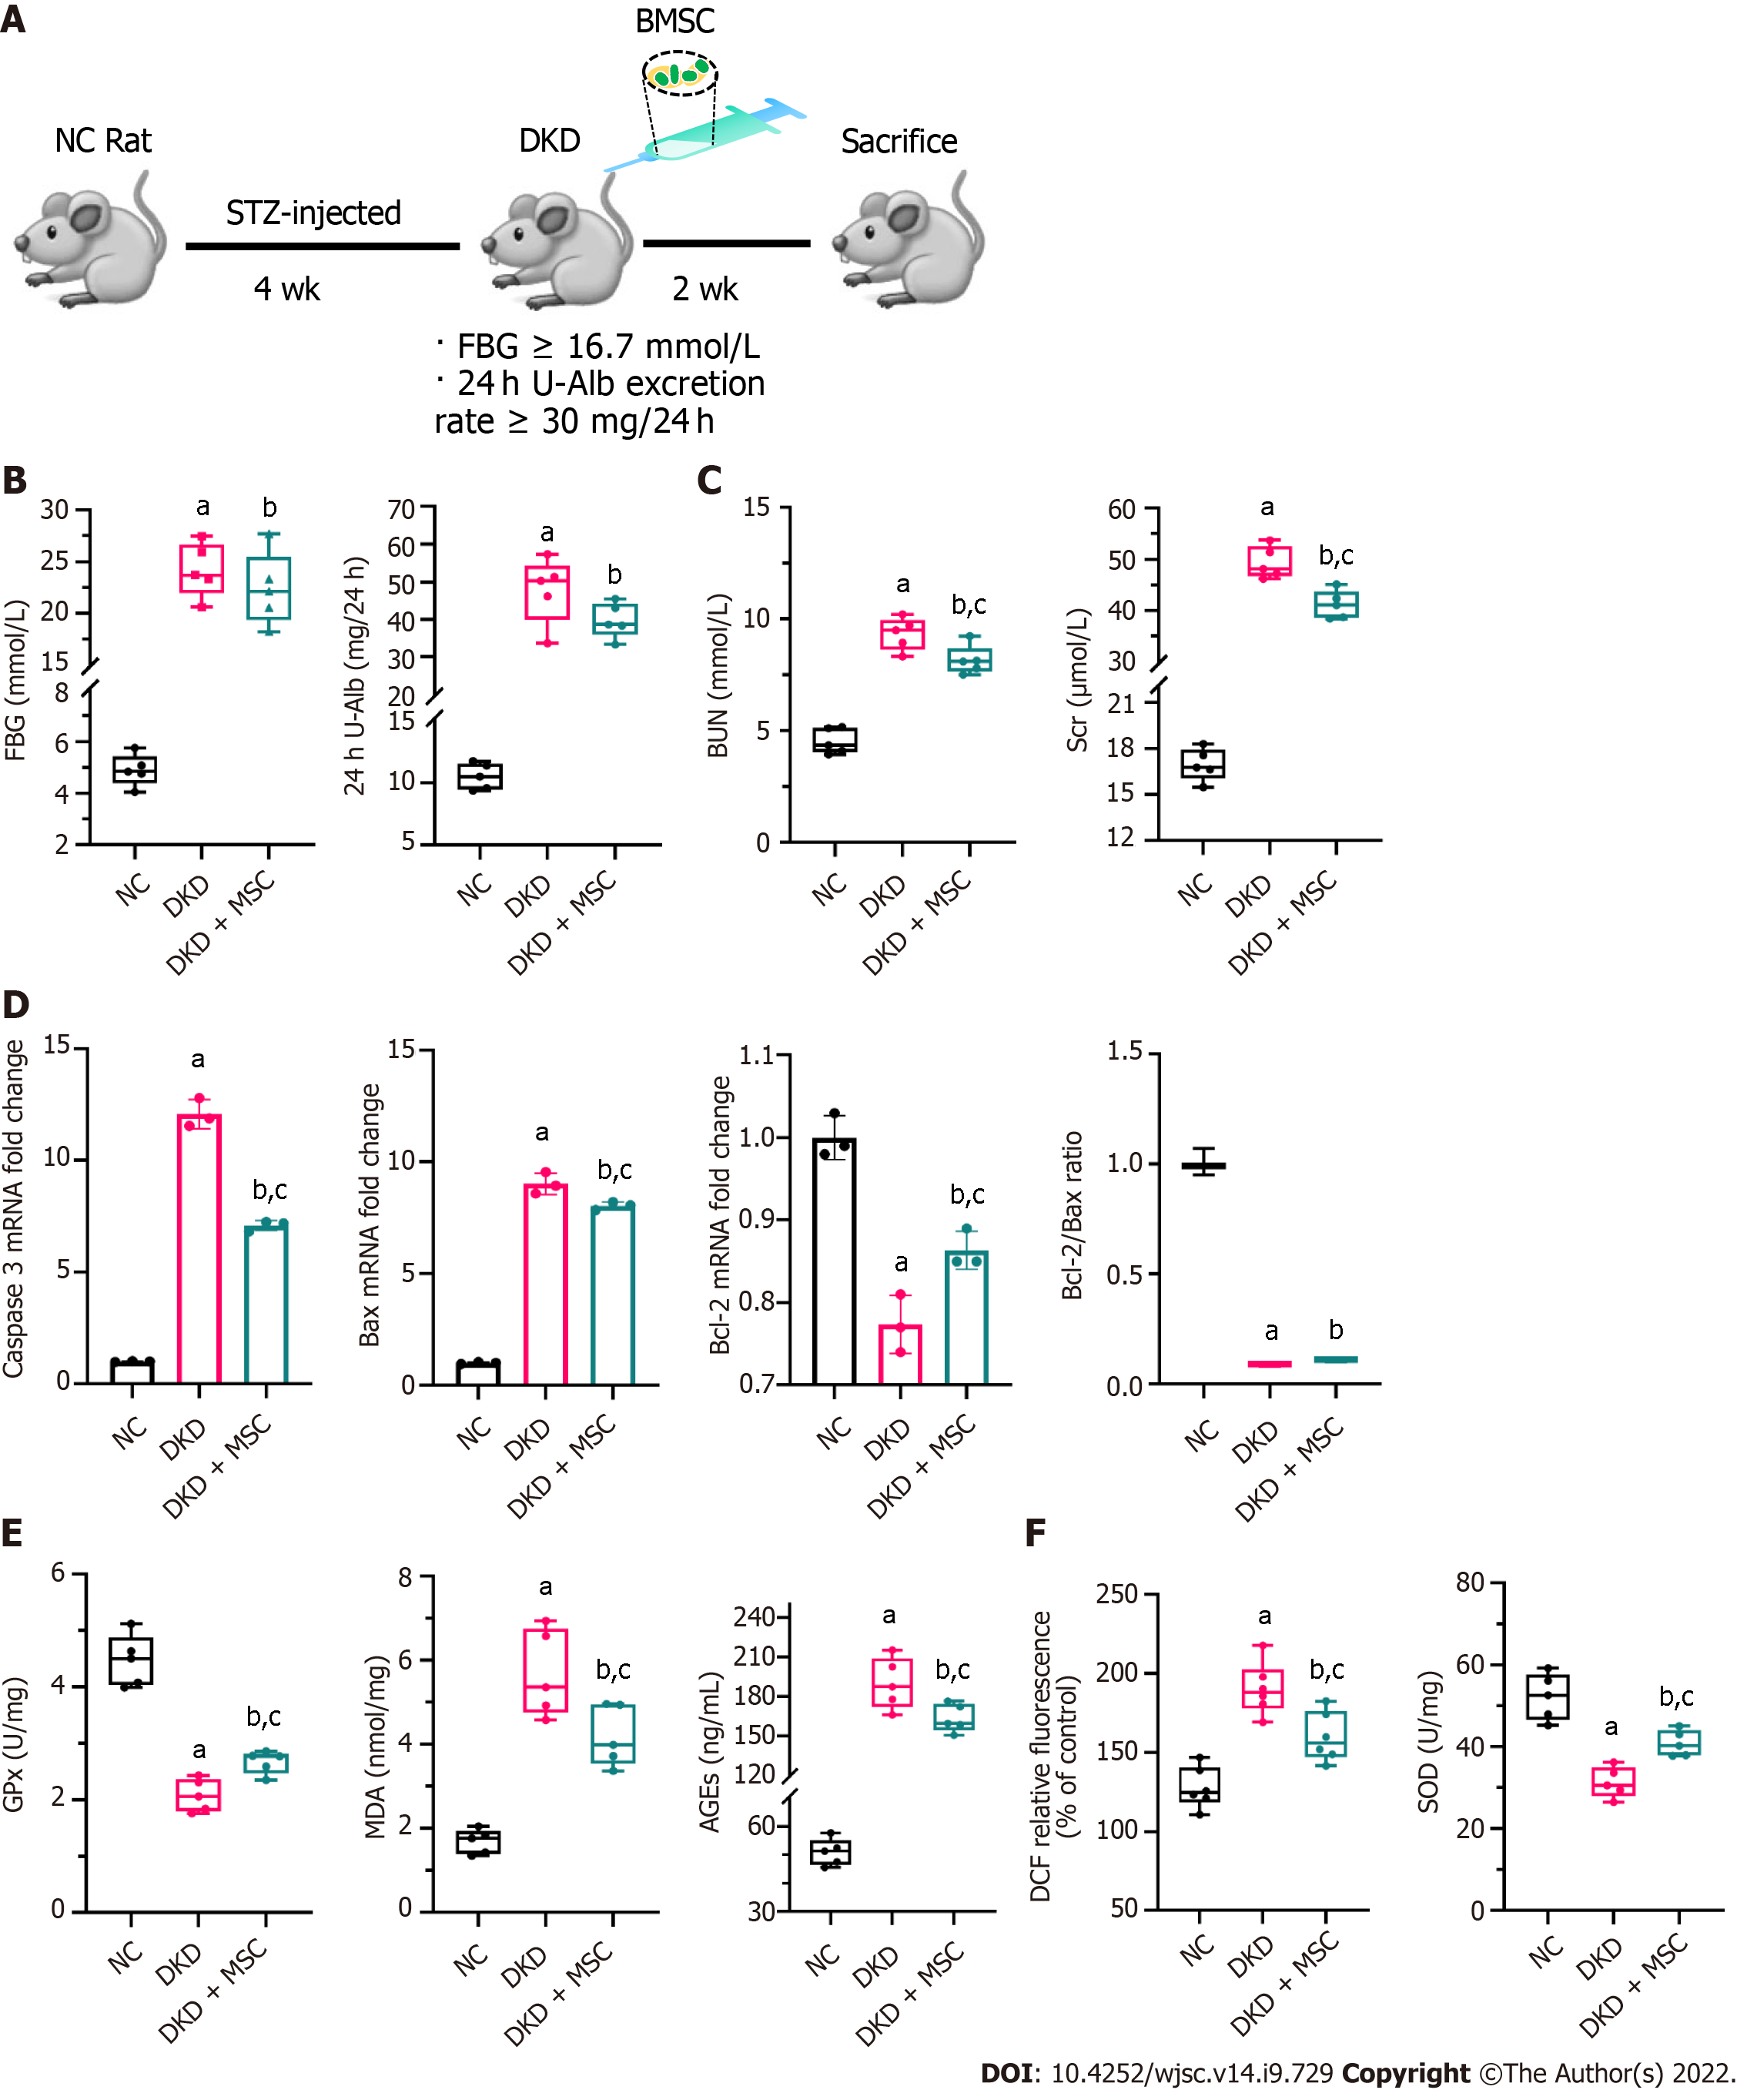
Figure 3 Effects of mesenchymal stem cell treatment on biochemical indexes.
A: Flowchart of rat treatment from day 0 to week 6; B: Fasting blood glucose and 24-h urinary albumin concentration; C: Concentrations of blood urea nitrogen and serum creatinine in rat serum; D: Relative mRNA expression of caspase 3, Bax, and B-cell lymphoma 2 (Bcl-2), and Bcl-2/Bax ratio in rat kidney tissues; E: Concentrations of glutathione peroxidase, malondialdehyde, and advanced glycation end products in rat kidney tissues; F: Levels of reactive oxygen species and superoxide dismutase in kidney tissues. Data are presented as the mean ± SD. aP < 0.001 vs normal control group, bP < 0.01 vs normal control group, cP < 0.05 vs diabetic kidney disease group. NC: Normal control; FBG: Fasting blood glucose; 24 h U-Alb: 24-h urinary albumin; BUN: Blood urea nitrogen; Scr: Serum creatinine; Bcl-2: B-cell lymphoma 2; Bax: BCL2-Associated X; GPx: Glutathione peroxidase; AGEs: Advanced glycation end products; MDA: Malondialdehyde; SOD: Superoxide dismutase; NC: Normal control; DKD: Diabetic kidney disease; MSCs: Mesenchymal stem cells.
- Citation: Tang LX, Wei B, Jiang LY, Ying YY, Li K, Chen TX, Huang RF, Shi MJ, Xu H. Intercellular mitochondrial transfer as a means of revitalizing injured glomerular endothelial cells. World J Stem Cells 2022; 14(9): 729-743
- URL: https://www.wjgnet.com/1948-0210/full/v14/i9/729.htm
- DOI: https://dx.doi.org/10.4252/wjsc.v14.i9.729


