Copyright
©The Author(s) 2022.
World J Stem Cells. Aug 26, 2022; 14(8): 633-657
Published online Aug 26, 2022. doi: 10.4252/wjsc.v14.i8.633
Published online Aug 26, 2022. doi: 10.4252/wjsc.v14.i8.633
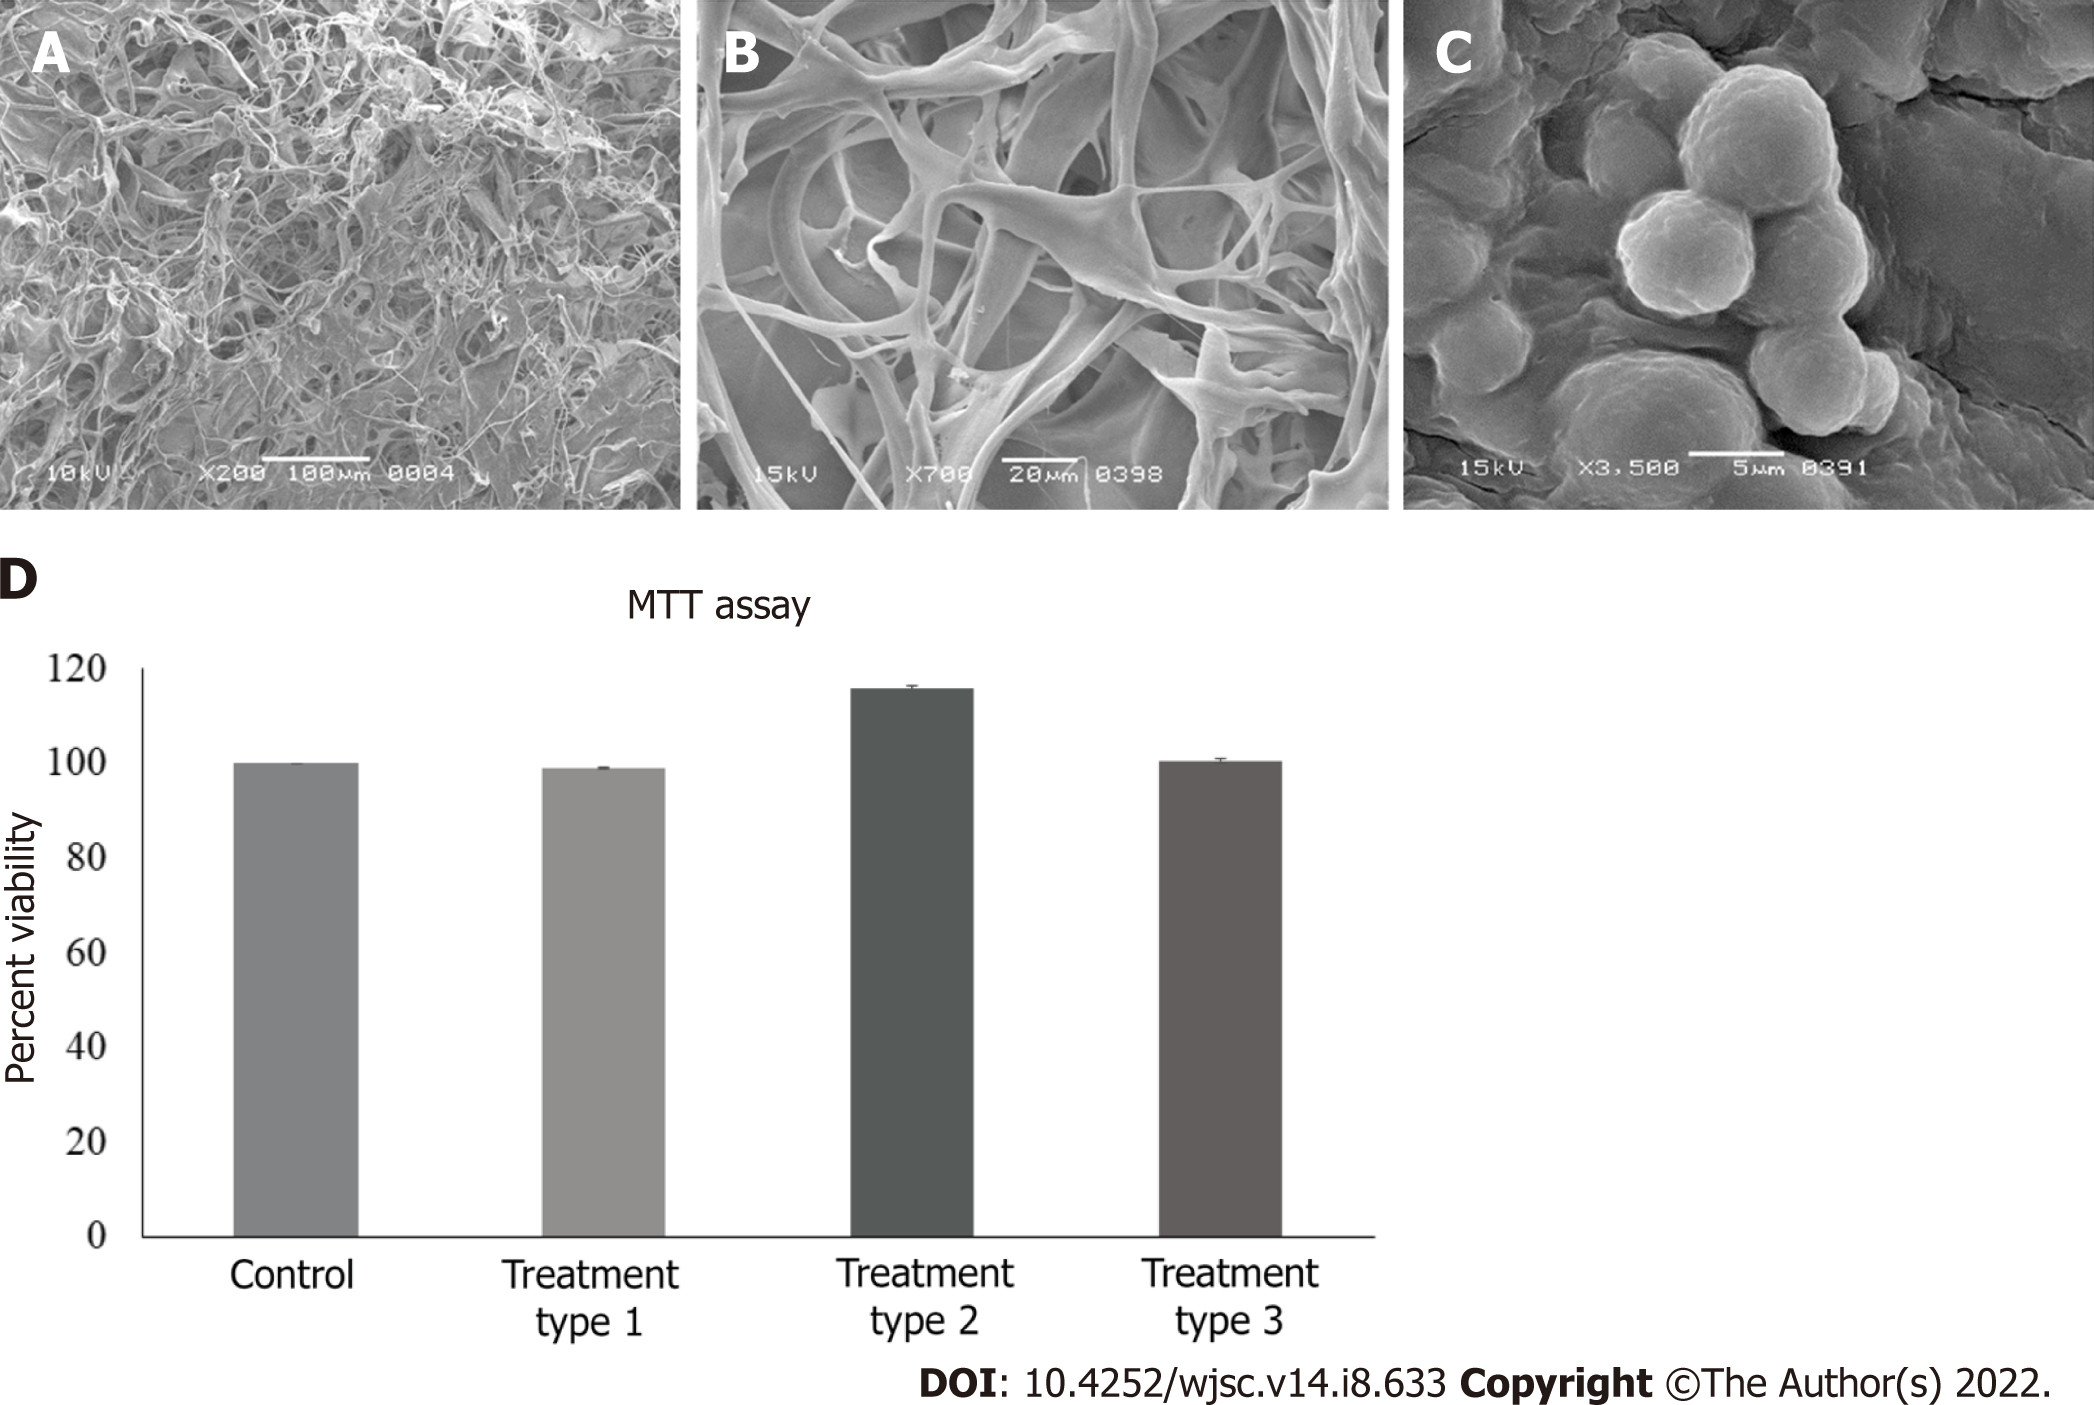
Figure 3 Scanning electron microscopy and cytotoxicity analysis.
A-C: Scanning electron microscopy analysis showing mesh like fiber network of (A) dry collagen scaffold, (B) collagen scaffold soaked in medium, and (C) spherical shaped mesenchymal stem cells (MSCs) in the scaffold; D: Cytotoxicity analysis of zebularine (3 μmol/L) treated MSC-seeded scaffolds. Bar graphs represent viable cells in all treatment groups as compared to untreated MSC-seeded collagen scaffold. Data is presented as mean ± standard error of mean with significance level aP < 0.05.
- Citation: Qazi REM, Khan I, Haneef K, Malick TS, Naeem N, Ahmad W, Salim A, Mohsin S. Combination of mesenchymal stem cells and three-dimensional collagen scaffold preserves ventricular remodeling in rat myocardial infarction model. World J Stem Cells 2022; 14(8): 633-657
- URL: https://www.wjgnet.com/1948-0210/full/v14/i8/633.htm
- DOI: https://dx.doi.org/10.4252/wjsc.v14.i8.633


