Copyright
©The Author(s) 2022.
World J Stem Cells. May 26, 2022; 14(5): 347-361
Published online May 26, 2022. doi: 10.4252/wjsc.v14.i5.347
Published online May 26, 2022. doi: 10.4252/wjsc.v14.i5.347
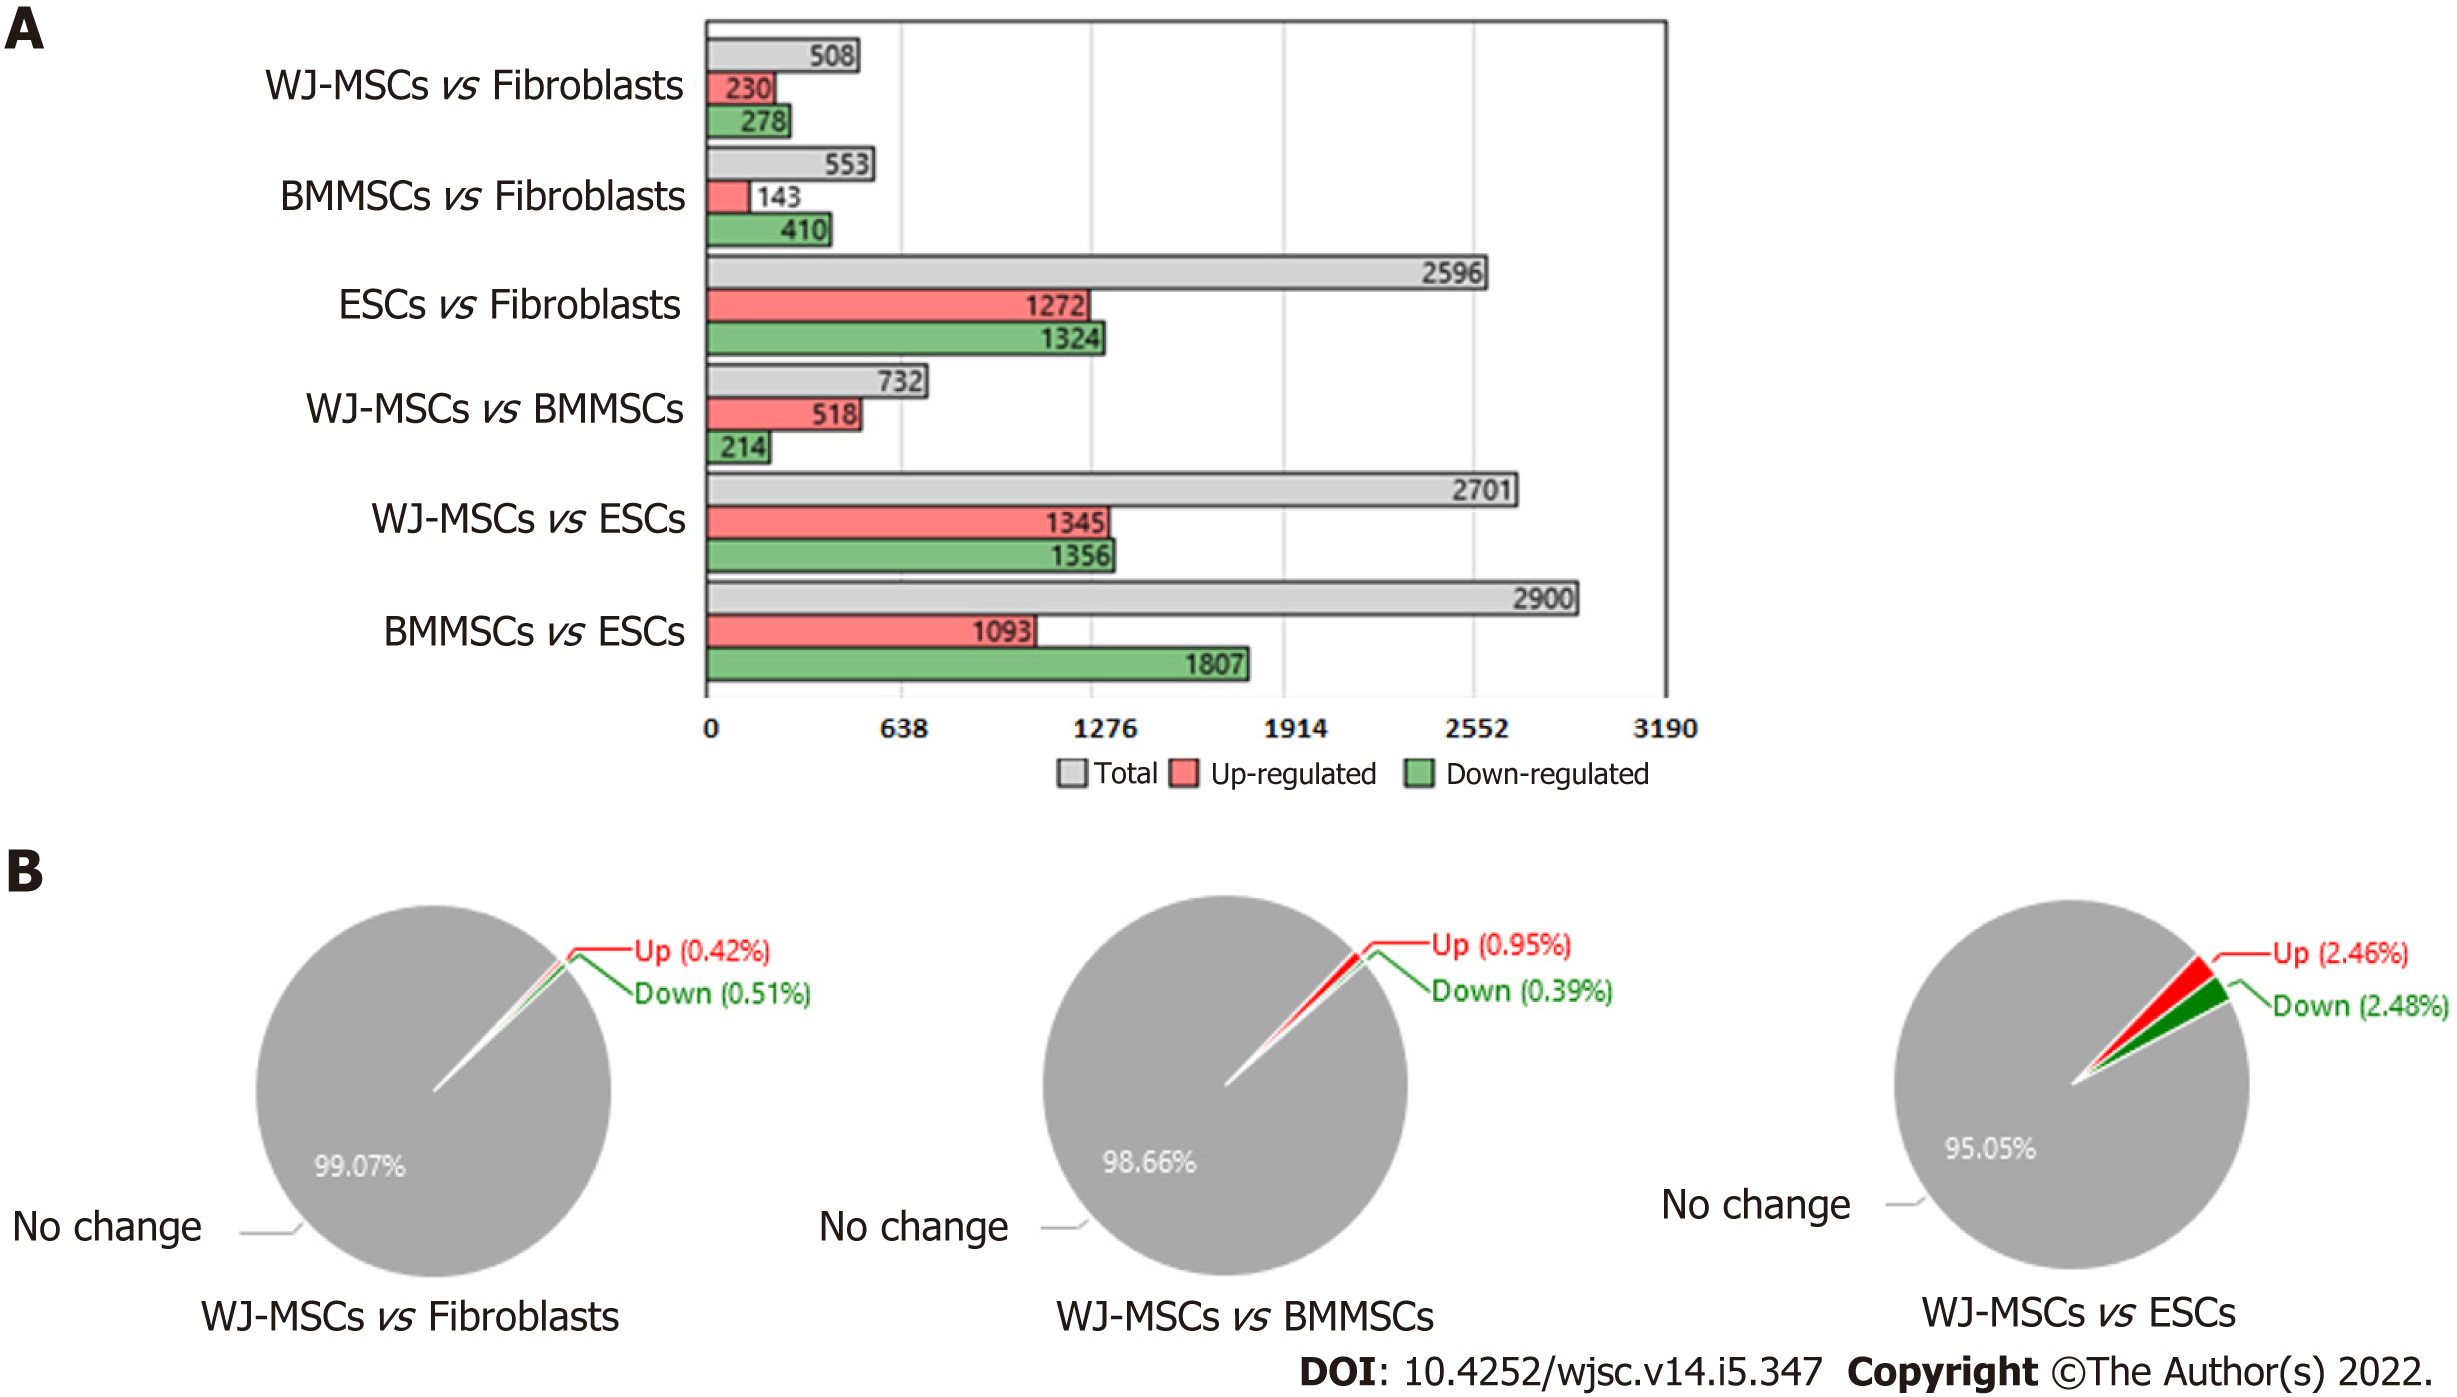
Figure 4 Comparative differential gene expression analysis of stem cells (Wharton’s jelly-derived mesenchymal stromal/stem cells, bone marrow mesenchymal stromal/stem cells and embryonic stem cells) vs fibroblasts.
A: Bar graph showed differential gene expression among different stem cells as well as with fibroblasts. Expression Analysis Settings: Fold change in gene expression < -5 or > 5 and P < 0.05, Anova Method: Ebayes; B: Pie chart showed percentage of gene expression in Wharton’s jelly-derived mesenchymal stromal/stem cells (MSCs), bone marrow MSCs, and embryonic stem cells as compared to fibroblasts. WJ-MSC: Wharton’s jelly-derived mesenchymal stromal/stem cells; BMMSC: Bone marrow mesenchymal stem cells; ESC: Embryonic stem cells.
- Citation: Maurya DK, Bandekar M, Sandur SK. Soluble factors secreted by human Wharton’s jelly mesenchymal stromal/stem cells exhibit therapeutic radioprotection: A mechanistic study with integrating network biology. World J Stem Cells 2022; 14(5): 347-361
- URL: https://www.wjgnet.com/1948-0210/full/v14/i5/347.htm
- DOI: https://dx.doi.org/10.4252/wjsc.v14.i5.347


