Copyright
©The Author(s) 2022.
World J Stem Cells. Feb 26, 2022; 14(2): 214-218
Published online Feb 26, 2022. doi: 10.4252/wjsc.v14.i2.214
Published online Feb 26, 2022. doi: 10.4252/wjsc.v14.i2.214
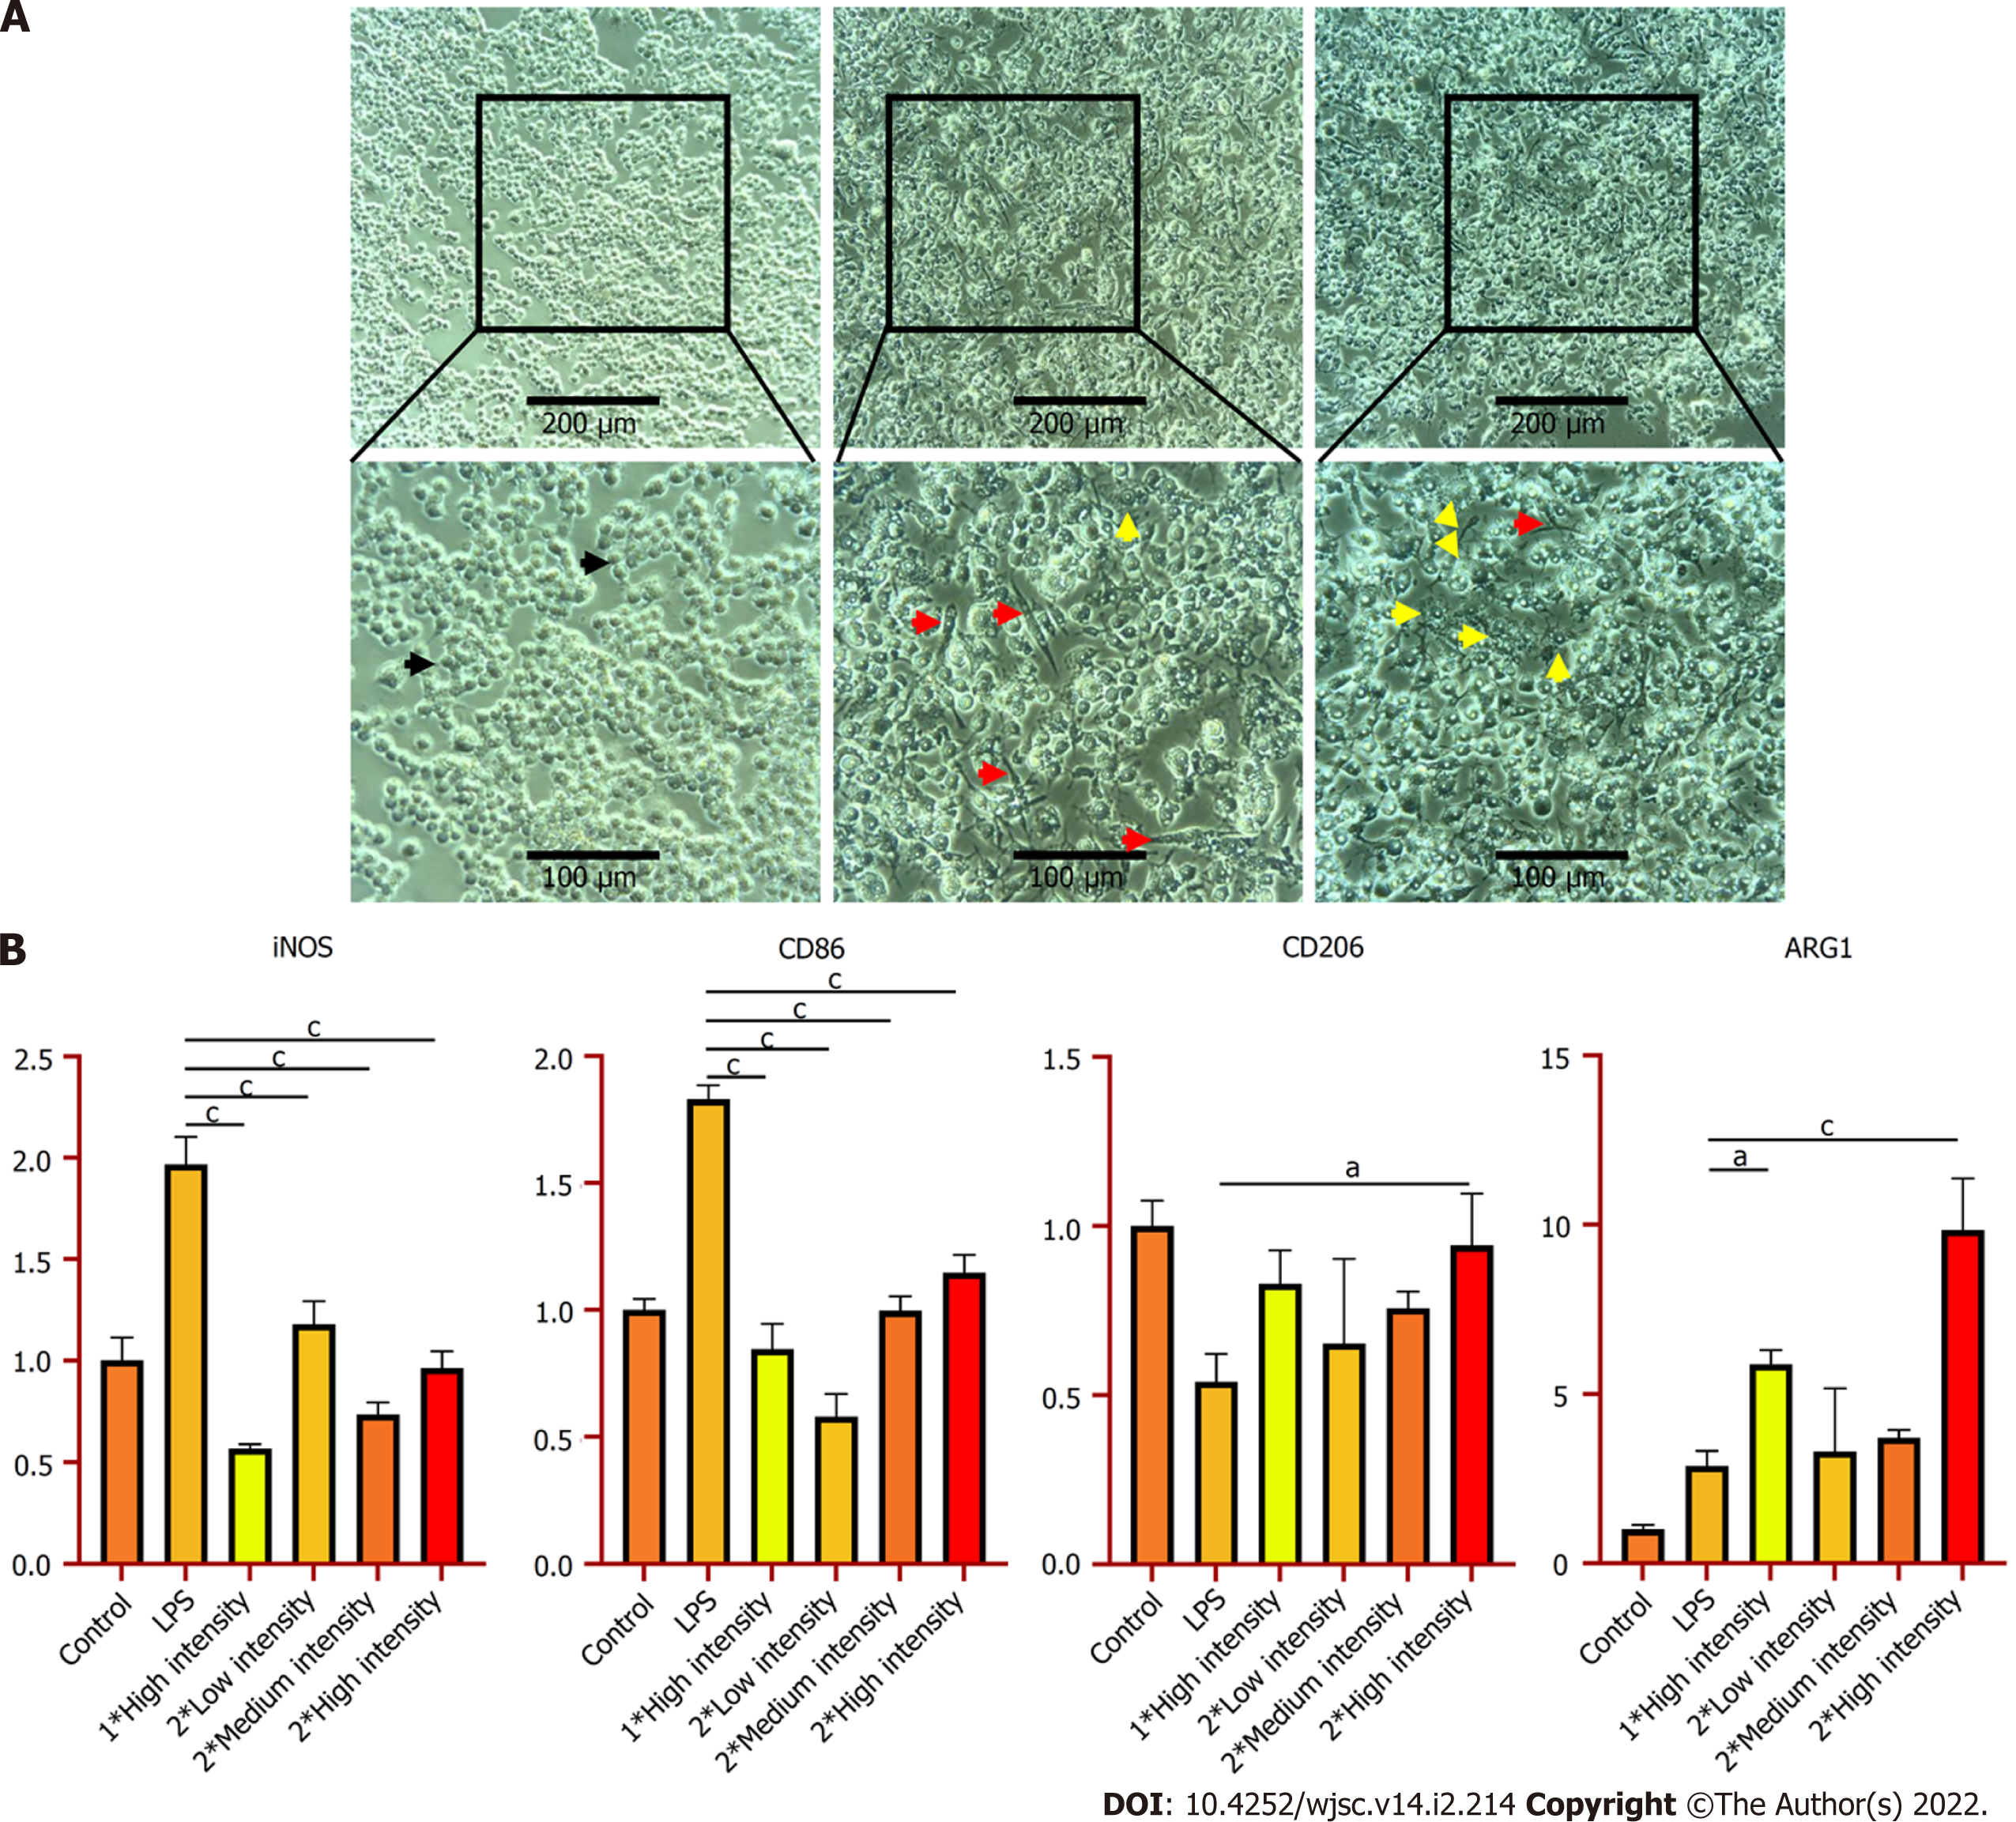
Figure 3 Low-intensity pulsed ultrasound shifts M1 macrophages towards M2 state.
A: The morphology of macrophages was observed by microscopy. Black, red, and yellow arrows represent M0, M1, and M2 macrophages, respectively; B: Quantitative polymerase chain reaction was used to detect the gene expression of cell phenotypes maker iNOS, CD86, CD206, and ARG1 after being treated by low-intensity pulsed ultrasound. Data are expressed as the mean ± standard error of the mean. aP < 0.05; bP < 0.01; cP < 0.001. Low intensity = 0.25 W/cm2, medium intensity = 0.5 W/cm2, and high intensity = 0.75 W/cm2.
- Citation: Qin HC, Luo ZW, Zhu YL. Physical energy-based ultrasound shifts M1 macrophage differentiation towards M2 state. World J Stem Cells 2022; 14(2): 214-218
- URL: https://www.wjgnet.com/1948-0210/full/v14/i2/214.htm
- DOI: https://dx.doi.org/10.4252/wjsc.v14.i2.214


