Copyright
©The Author(s) 2022.
World J Stem Cells. Dec 26, 2022; 14(12): 822-838
Published online Dec 26, 2022. doi: 10.4252/wjsc.v14.i12.822
Published online Dec 26, 2022. doi: 10.4252/wjsc.v14.i12.822
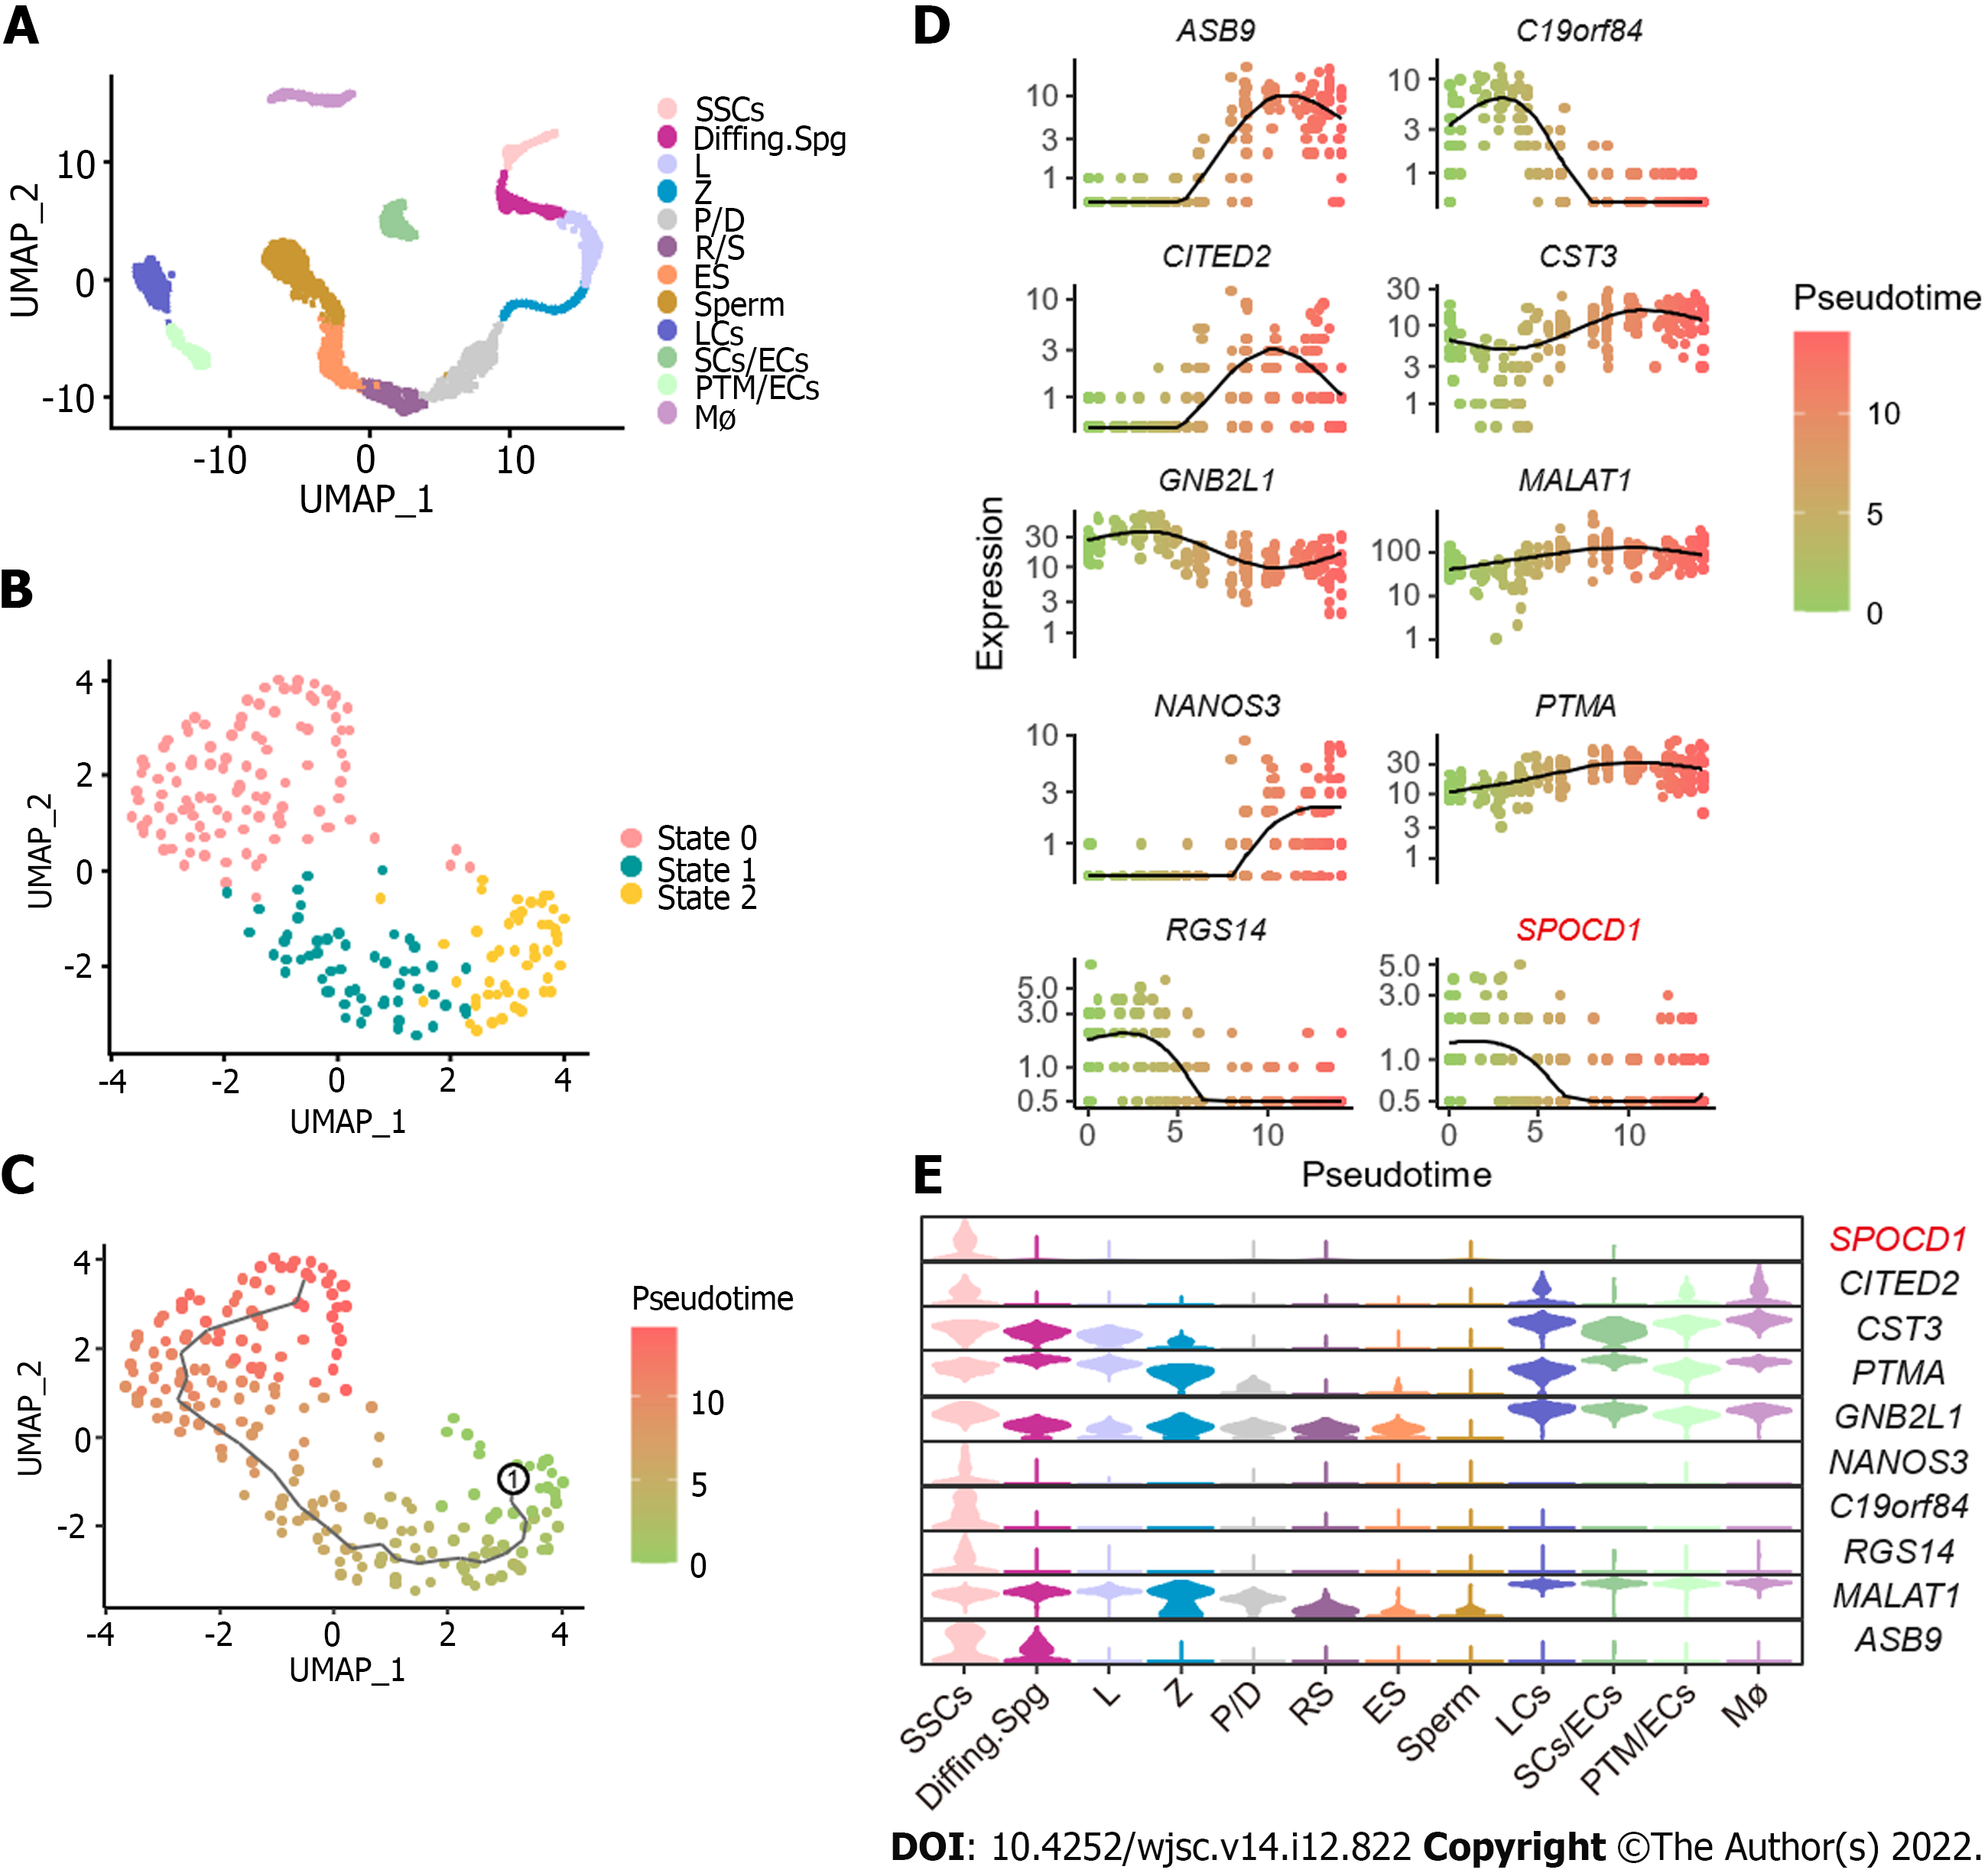
Figure 2 Integrated analysis of human testes single-cell sequencing datasets (GSE149512 and GSE112013).
A: Uniform manifold approximation and projection (UMAP) and clustering analyses of combined single-cell transcriptomic data from human testes; B: UMAP and re-clustering analysis of spermatogonial stem cell (SSC) clusters, each dot represents a single cell and is colored according to legends; C: Pseudo-time analysis of SSC cluster showing three discrete cellular states (states 0, 1, and 2) during SSC development, the black curve is the developmental trajectory created by the Monocle 3 package, and character 1 represents the starting point of the developmental trajectory; D: Expression levels of the top 10 differentially expressed genes (DEGs) during SSC development. The black curve is the mean level expression along with pseudotime; E: Violin plots show the expression levels of the top 10 DEGs in all testicular cells. Diffing.Spg: Differentiating spermatogonia; ES: Elongated spermatids; L: Leptotene spermatocytes; LCs: Leydig cells; Mø: Macrophages; P/D: Pachytene/diplotene spermatocytes; PTM/ECs: Peritubular myoid cells/endothelial cells; RS: Round spermatids; SCs/ECs: Sertoli cells/endothelial cells; Z: Zygotene spermatocytes.
- Citation: Zhou D, Zhu F, Huang ZH, Zhang H, Fan LQ, Fan JY. SPOC domain-containing protein 1 regulates the proliferation and apoptosis of human spermatogonial stem cells through adenylate kinase 4. World J Stem Cells 2022; 14(12): 822-838
- URL: https://www.wjgnet.com/1948-0210/full/v14/i12/822.htm
- DOI: https://dx.doi.org/10.4252/wjsc.v14.i12.822


