Copyright
©The Author(s) 2021.
World J Stem Cells. May 26, 2021; 13(5): 452-469
Published online May 26, 2021. doi: 10.4252/wjsc.v13.i5.452
Published online May 26, 2021. doi: 10.4252/wjsc.v13.i5.452
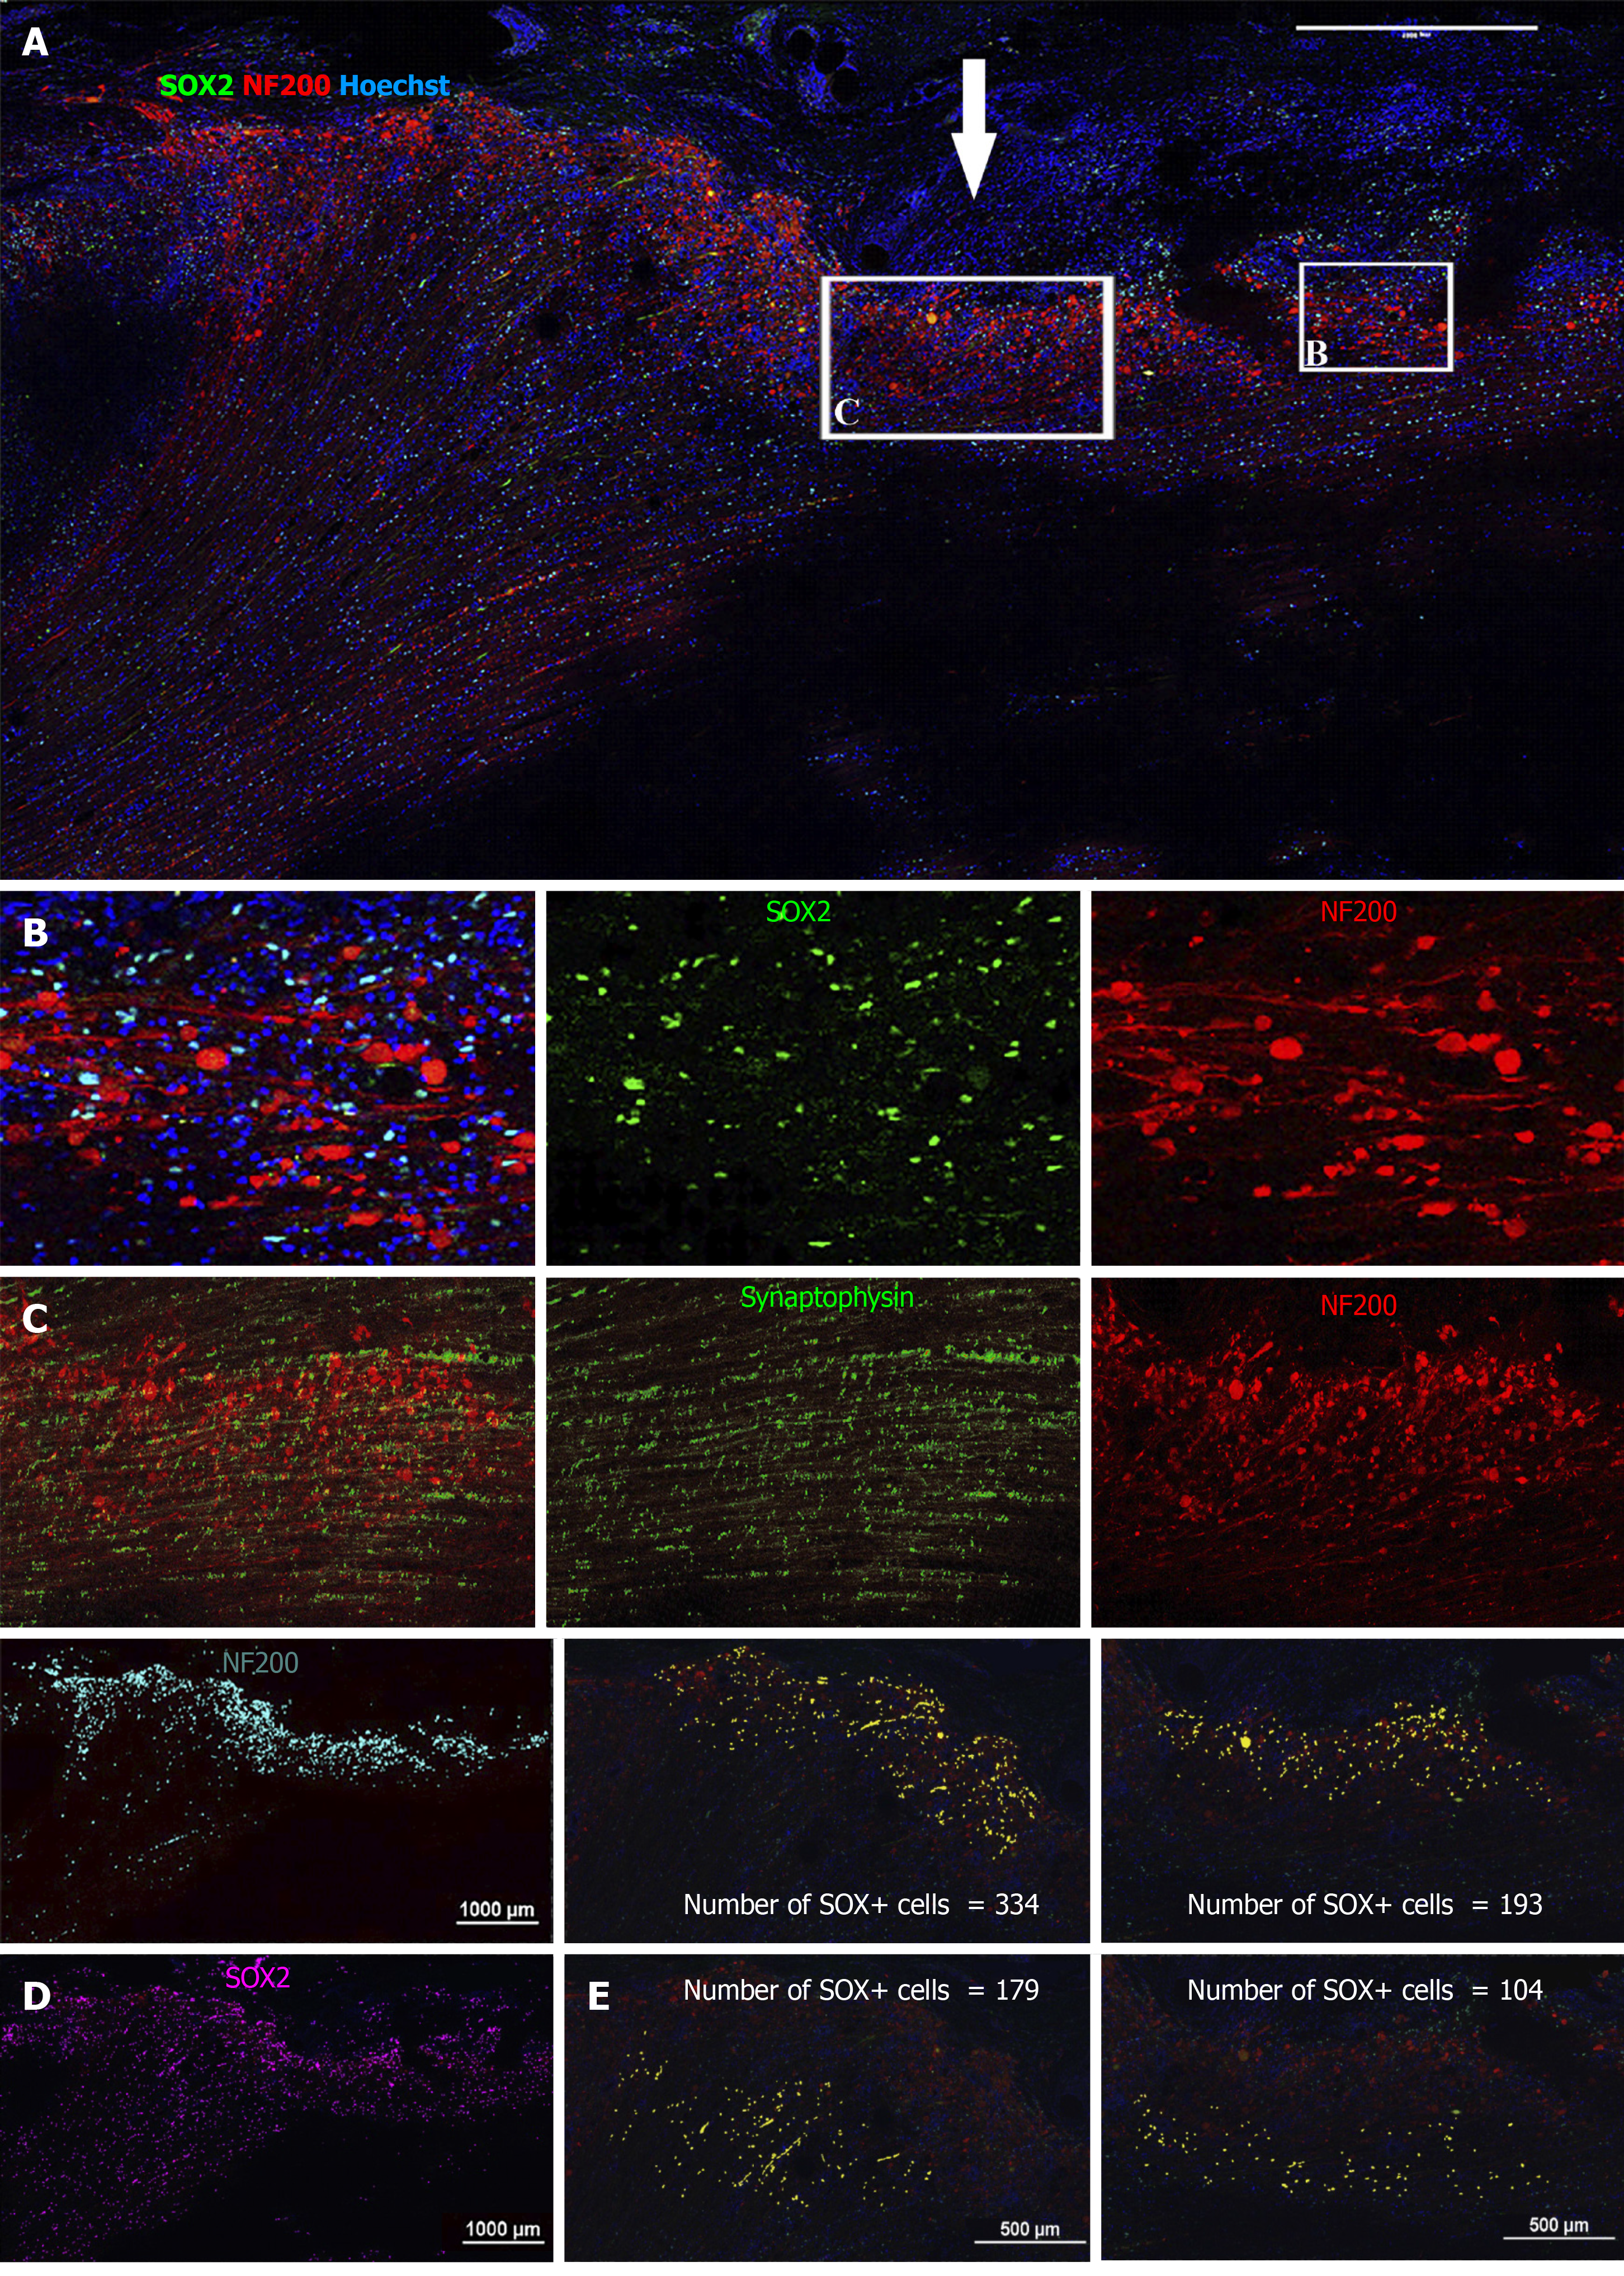
Figure 6 Immunohistochemical analysis of NF200 and SRY-box transcription factor 2 on spinal cord sagittal sections 12 wk after transplantation (animal NPC4).
A: Large image showing the center of injury (arrow). Squares show approximate localization of enlarged panels B and C; B: Enlarged image of SRY-box transcription factor 2 (SOX2) (green) and NF200 (red) staining; C: Enlarged image of synaptophysin (green) and NF200 (red) staining; D: The results of quantification of NF200 (blue) and SOX2 (magenta); binary selection; and E: Upper images: yellow dots-number of SOX2-positive cells in the high intensity zone of NF200 fluorescence (area of growth cones); Lower images: yellow dots-number of SOX2-positive cells in the low intensity zone of NF200 fluorescence. Bar size 500–1000 µm.
- Citation: Baklaushev VP, Durov OV, Kalsin VA, Gulaev EV, Kim SV, Gubskiy IL, Revkova VA, Samoilova EM, Melnikov PA, Karal-Ogly DD, Orlov SV, Troitskiy AV, Chekhonin VP, Averyanov AV, Ahlfors JE. Disease modifying treatment of spinal cord injury with directly reprogrammed neural precursor cells in non-human primates. World J Stem Cells 2021; 13(5): 452-469
- URL: https://www.wjgnet.com/1948-0210/full/v13/i5/452.htm
- DOI: https://dx.doi.org/10.4252/wjsc.v13.i5.452


