Copyright
©The Author(s) 2021.
World J Stem Cells. May 26, 2021; 13(5): 452-469
Published online May 26, 2021. doi: 10.4252/wjsc.v13.i5.452
Published online May 26, 2021. doi: 10.4252/wjsc.v13.i5.452
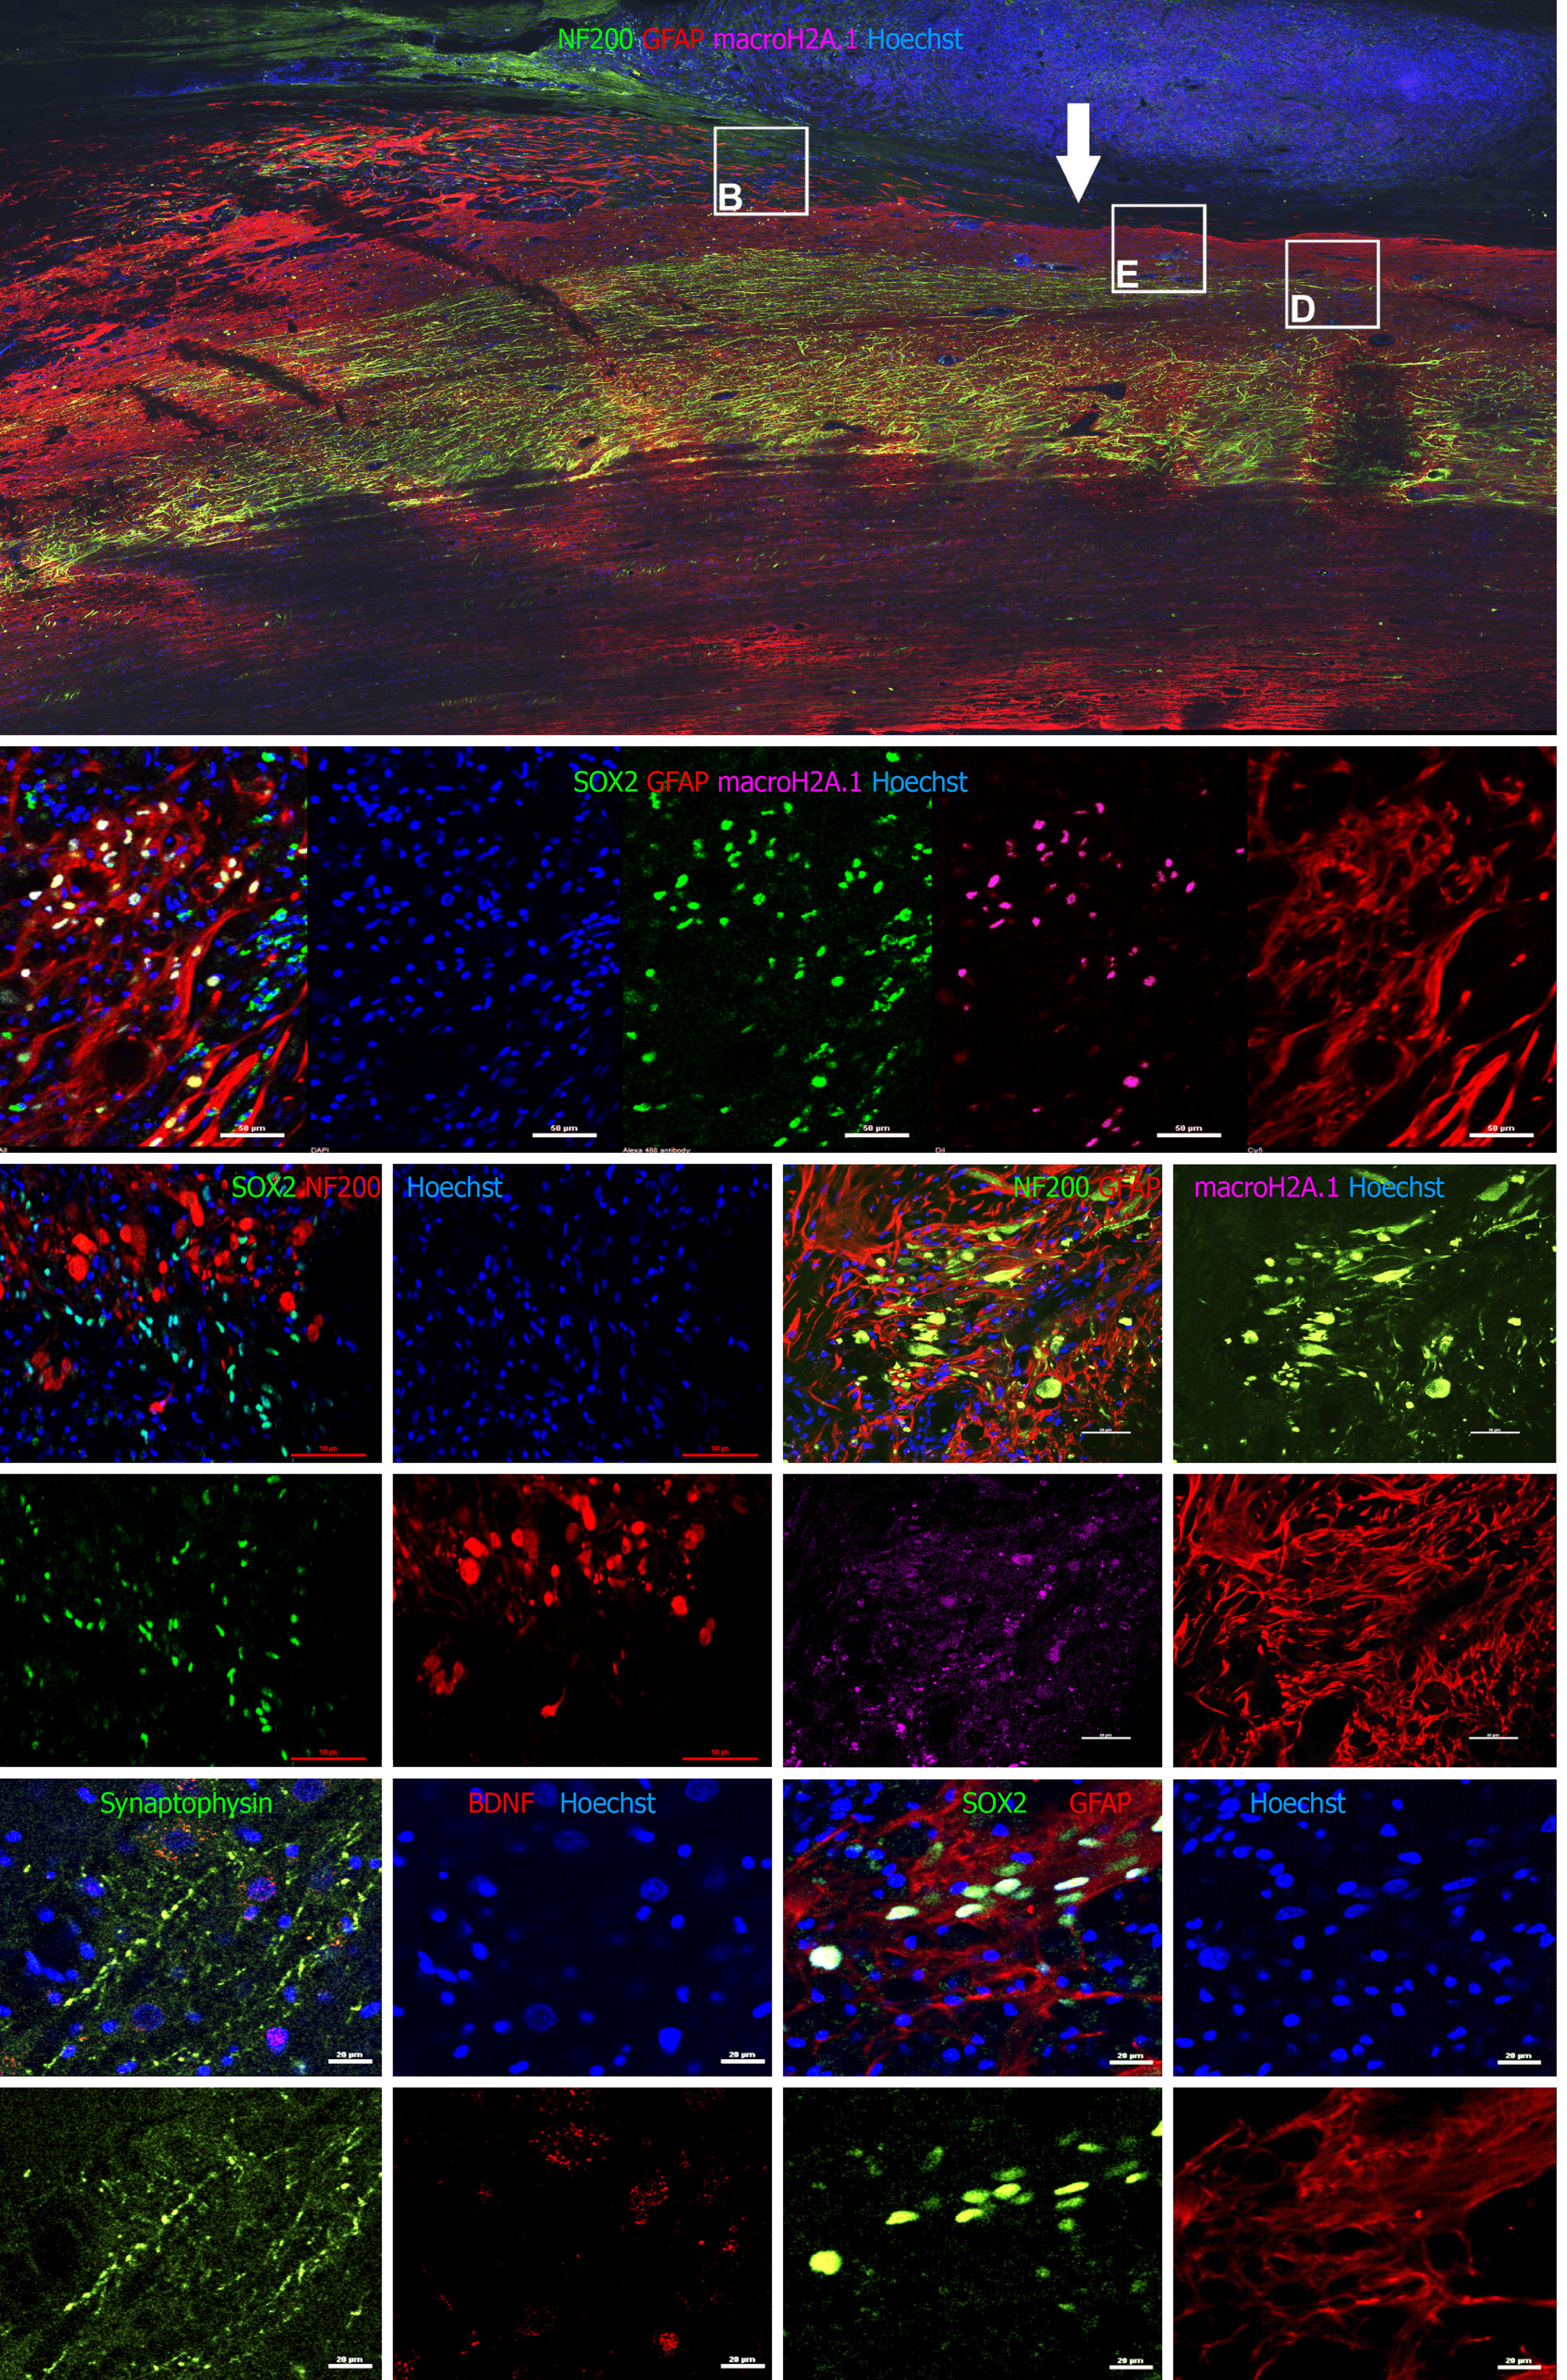
Figure 5 Immunohistochemical analysis on spinal cord sagittal sections 12 wk after transplantation.
A: Large image showing the center of injury (white arrow) of animal NPC1 stained with antibodies to NF200 (green) glial fibrillary acidic protein (GFAP) (red) and macro H2A.1 (magenta; staining is visible only in enlarged panels). Squares show approximate localization of enlarged panels B, D, and E (B and E stained with different antibody cocktails); B: Enlarged fragment of a sagittal section of animal NPC 1 stained for SRY-box transcription factor 2 (SOX2) (green), GFAP (red) and macro-H2A.1 (magenta). SOX2 and macro H2A.1 colocalized in the same cells (Pearson correlation = 0.78); C: Enlarged fragment of sagittal section of animal NPC4 stained for NF200 (red) and SOX2 (green). NF200 and SOX2 did not colocalize (Pearson correlation = 0.20); D: Enlarged fragment of sagittal section stained for NF200 (green, growth cones are shown), GFAP (red, astrogliosis area), and macro H2A.1 (magenta), animal NPC1. NF200 and macro H2A.1 did not colocalize (Pearson correlation = 0.20); E: Enlarged fragment of sagittal section stained for synaptophysin (green) and brain derived neurotrophic factor (red), animal NPC1; F: A sagittal section of animal NPC4 spinal cord near the injury epicenter stained for SOX2 (green) and GFAP (red). Size bar 50 µm (A-D), and 2 µm (E-F).
- Citation: Baklaushev VP, Durov OV, Kalsin VA, Gulaev EV, Kim SV, Gubskiy IL, Revkova VA, Samoilova EM, Melnikov PA, Karal-Ogly DD, Orlov SV, Troitskiy AV, Chekhonin VP, Averyanov AV, Ahlfors JE. Disease modifying treatment of spinal cord injury with directly reprogrammed neural precursor cells in non-human primates. World J Stem Cells 2021; 13(5): 452-469
- URL: https://www.wjgnet.com/1948-0210/full/v13/i5/452.htm
- DOI: https://dx.doi.org/10.4252/wjsc.v13.i5.452


