Copyright
©The Author(s) 2021.
World J Stem Cells. May 26, 2021; 13(5): 452-469
Published online May 26, 2021. doi: 10.4252/wjsc.v13.i5.452
Published online May 26, 2021. doi: 10.4252/wjsc.v13.i5.452
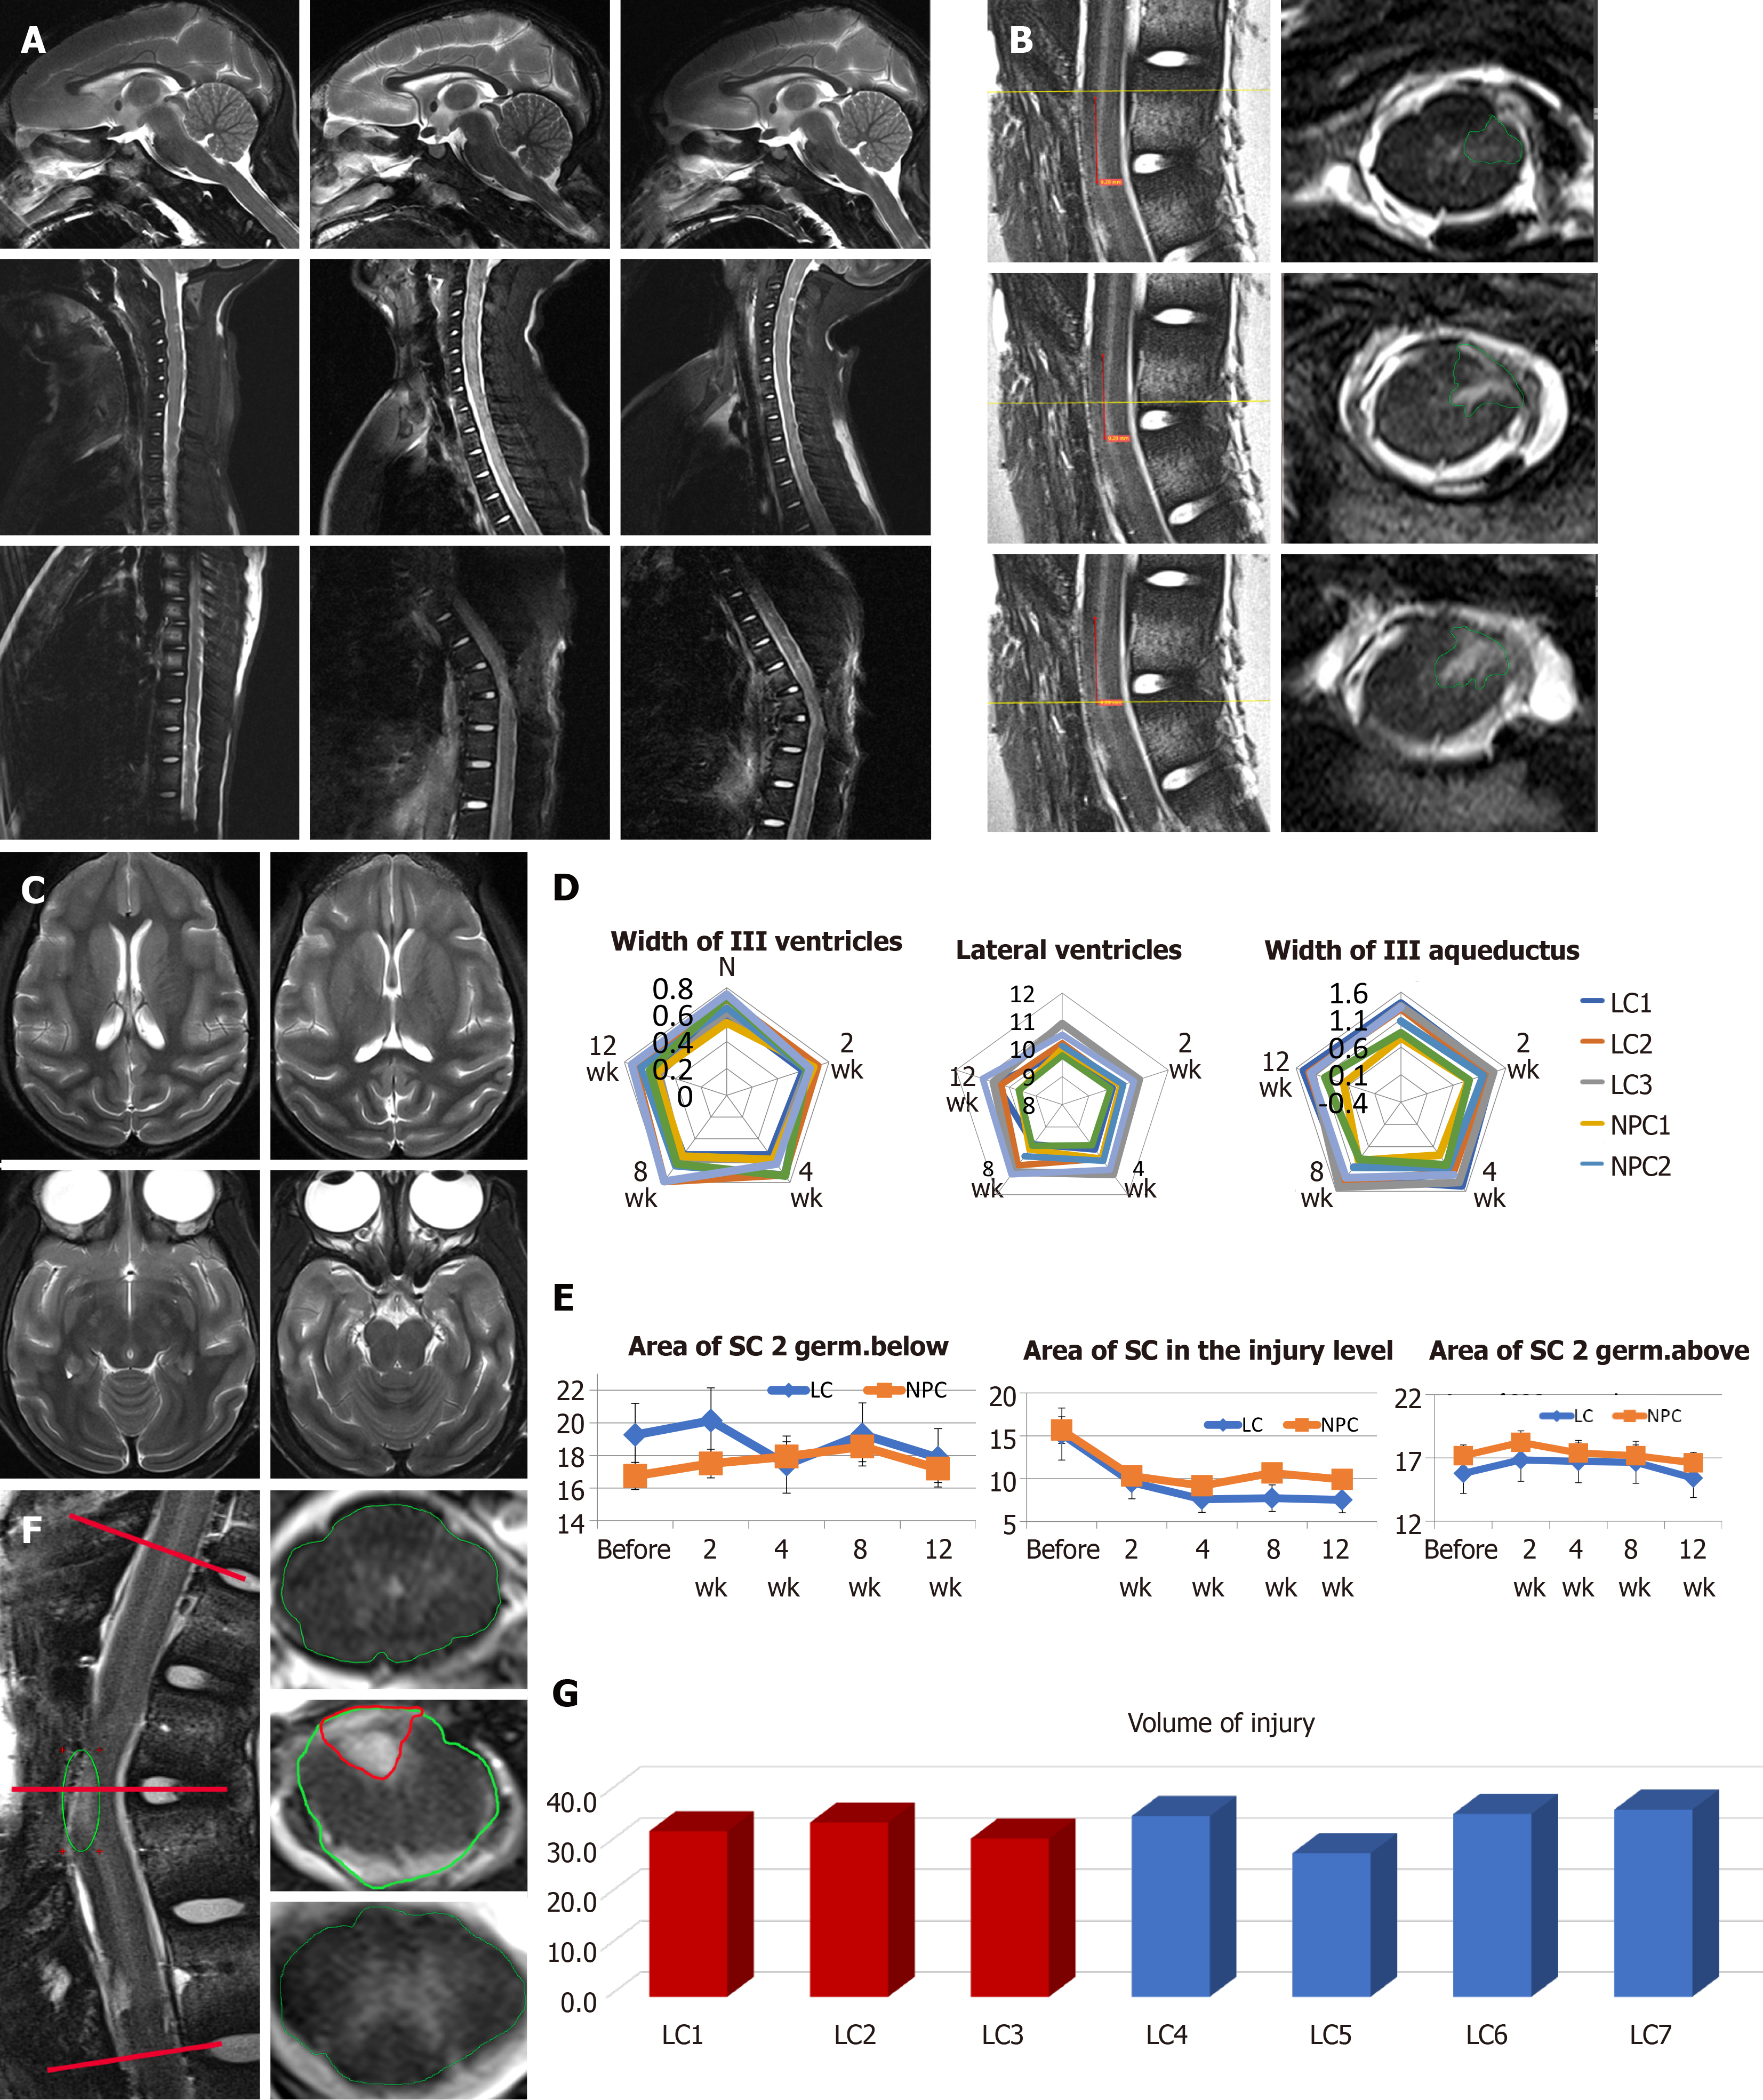
Figure 4 T2 weighted magnetic resonance imaging and the results of the brain and spinal cord morphometry.
A: Sagittal sections of the brain and the cervical and thoracic spinal cord of animal NPC1 before the lesion (left column), 2 wk after the lesion, just before the transplantation (middle column) and 12 wk after the transplantation (right column). The site of the injury is shown by white arrows; B: Postmortem high-resolution magnetic resonance diffusion tensor imaging of the spinal cord of animal NPC1. Left column: sagittal sections, right column: coronal sections from the upper part, middle part, and lower part of the injury (from top to bottom). The projection planes of coronal sections shown by yellow lines on corresponding sagittal sections. The middle part of the injury was shown by green arrow; C: Coronal sections of the brain, animal NPC2; D: Morphometry of the brain ventricles monitored 12 wk after the transplantation in animals of the lesion control (LC) group and neural progenitor cell (NPC) group; E: Morphometry of the spinal cord area in the lesion site, and two segments above and below; F: The example of sagittal (left column) and coronal (right column) sections with highlighted spinal cord and injury areas. The projection planes of coronal sections shown by red lines of the sagittal one; G: The results of spinal cord lesion volume calculation at week 12.
- Citation: Baklaushev VP, Durov OV, Kalsin VA, Gulaev EV, Kim SV, Gubskiy IL, Revkova VA, Samoilova EM, Melnikov PA, Karal-Ogly DD, Orlov SV, Troitskiy AV, Chekhonin VP, Averyanov AV, Ahlfors JE. Disease modifying treatment of spinal cord injury with directly reprogrammed neural precursor cells in non-human primates. World J Stem Cells 2021; 13(5): 452-469
- URL: https://www.wjgnet.com/1948-0210/full/v13/i5/452.htm
- DOI: https://dx.doi.org/10.4252/wjsc.v13.i5.452


