Copyright
©The Author(s) 2021.
World J Stem Cells. Dec 26, 2021; 13(12): 1928-1946
Published online Dec 26, 2021. doi: 10.4252/wjsc.v13.i12.1928
Published online Dec 26, 2021. doi: 10.4252/wjsc.v13.i12.1928
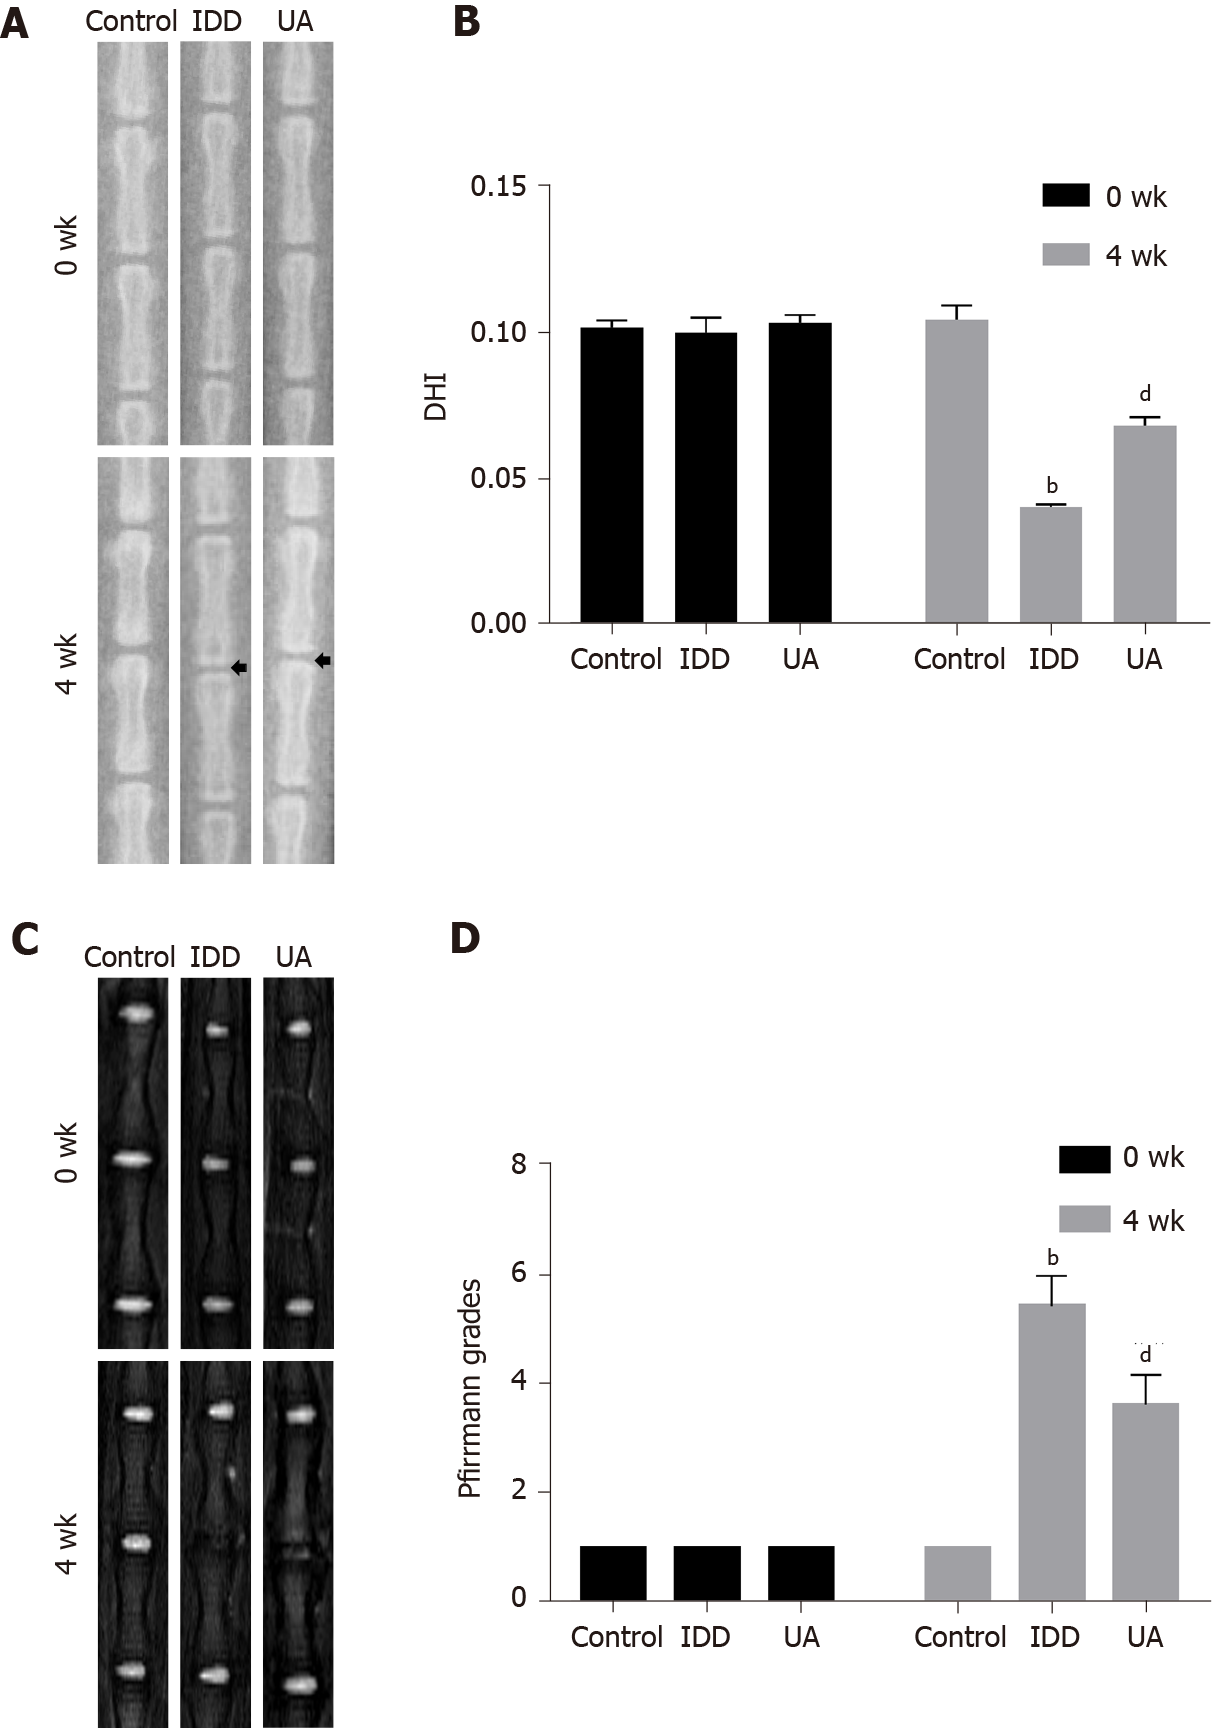
Figure 7 X-ray and magnetic resonance imaging evaluation in intervertebral disc degeneration animal models.
A: The X-ray in different groups at 0 wk and 4 wk after puncturing; B: Quantitative analysis of the disc height index in different groups; C: The magnetic resonance imaging results of different groups at 0 wk and 4 wk after puncture; D: Quantitative analysis of Pfirrmann grades in different groups. All data are expressed as the mean ± SD. aP < 0.05, bP < 0.01 compared with control group; cP < 0.05, dP < 0.01 compared with H2O2 group; eP < 0.05, fP < 0.01 compared with UA group. DHI: Disc height index; MRI: Magnetic resonance imaging; IDD: Intervertebral disc degeneration; UA: Urolithin A.
- Citation: Shi PZ, Wang JW, Wang PC, Han B, Lu XH, Ren YX, Feng XM, Cheng XF, Zhang L. Urolithin a alleviates oxidative stress-induced senescence in nucleus pulposus-derived mesenchymal stem cells through SIRT1/PGC-1α pathway. World J Stem Cells 2021; 13(12): 1928-1946
- URL: https://www.wjgnet.com/1948-0210/full/v13/i12/1928.htm
- DOI: https://dx.doi.org/10.4252/wjsc.v13.i12.1928


