Copyright
©The Author(s) 2021.
World J Stem Cells. Dec 26, 2021; 13(12): 1905-1917
Published online Dec 26, 2021. doi: 10.4252/wjsc.v13.i12.1905
Published online Dec 26, 2021. doi: 10.4252/wjsc.v13.i12.1905
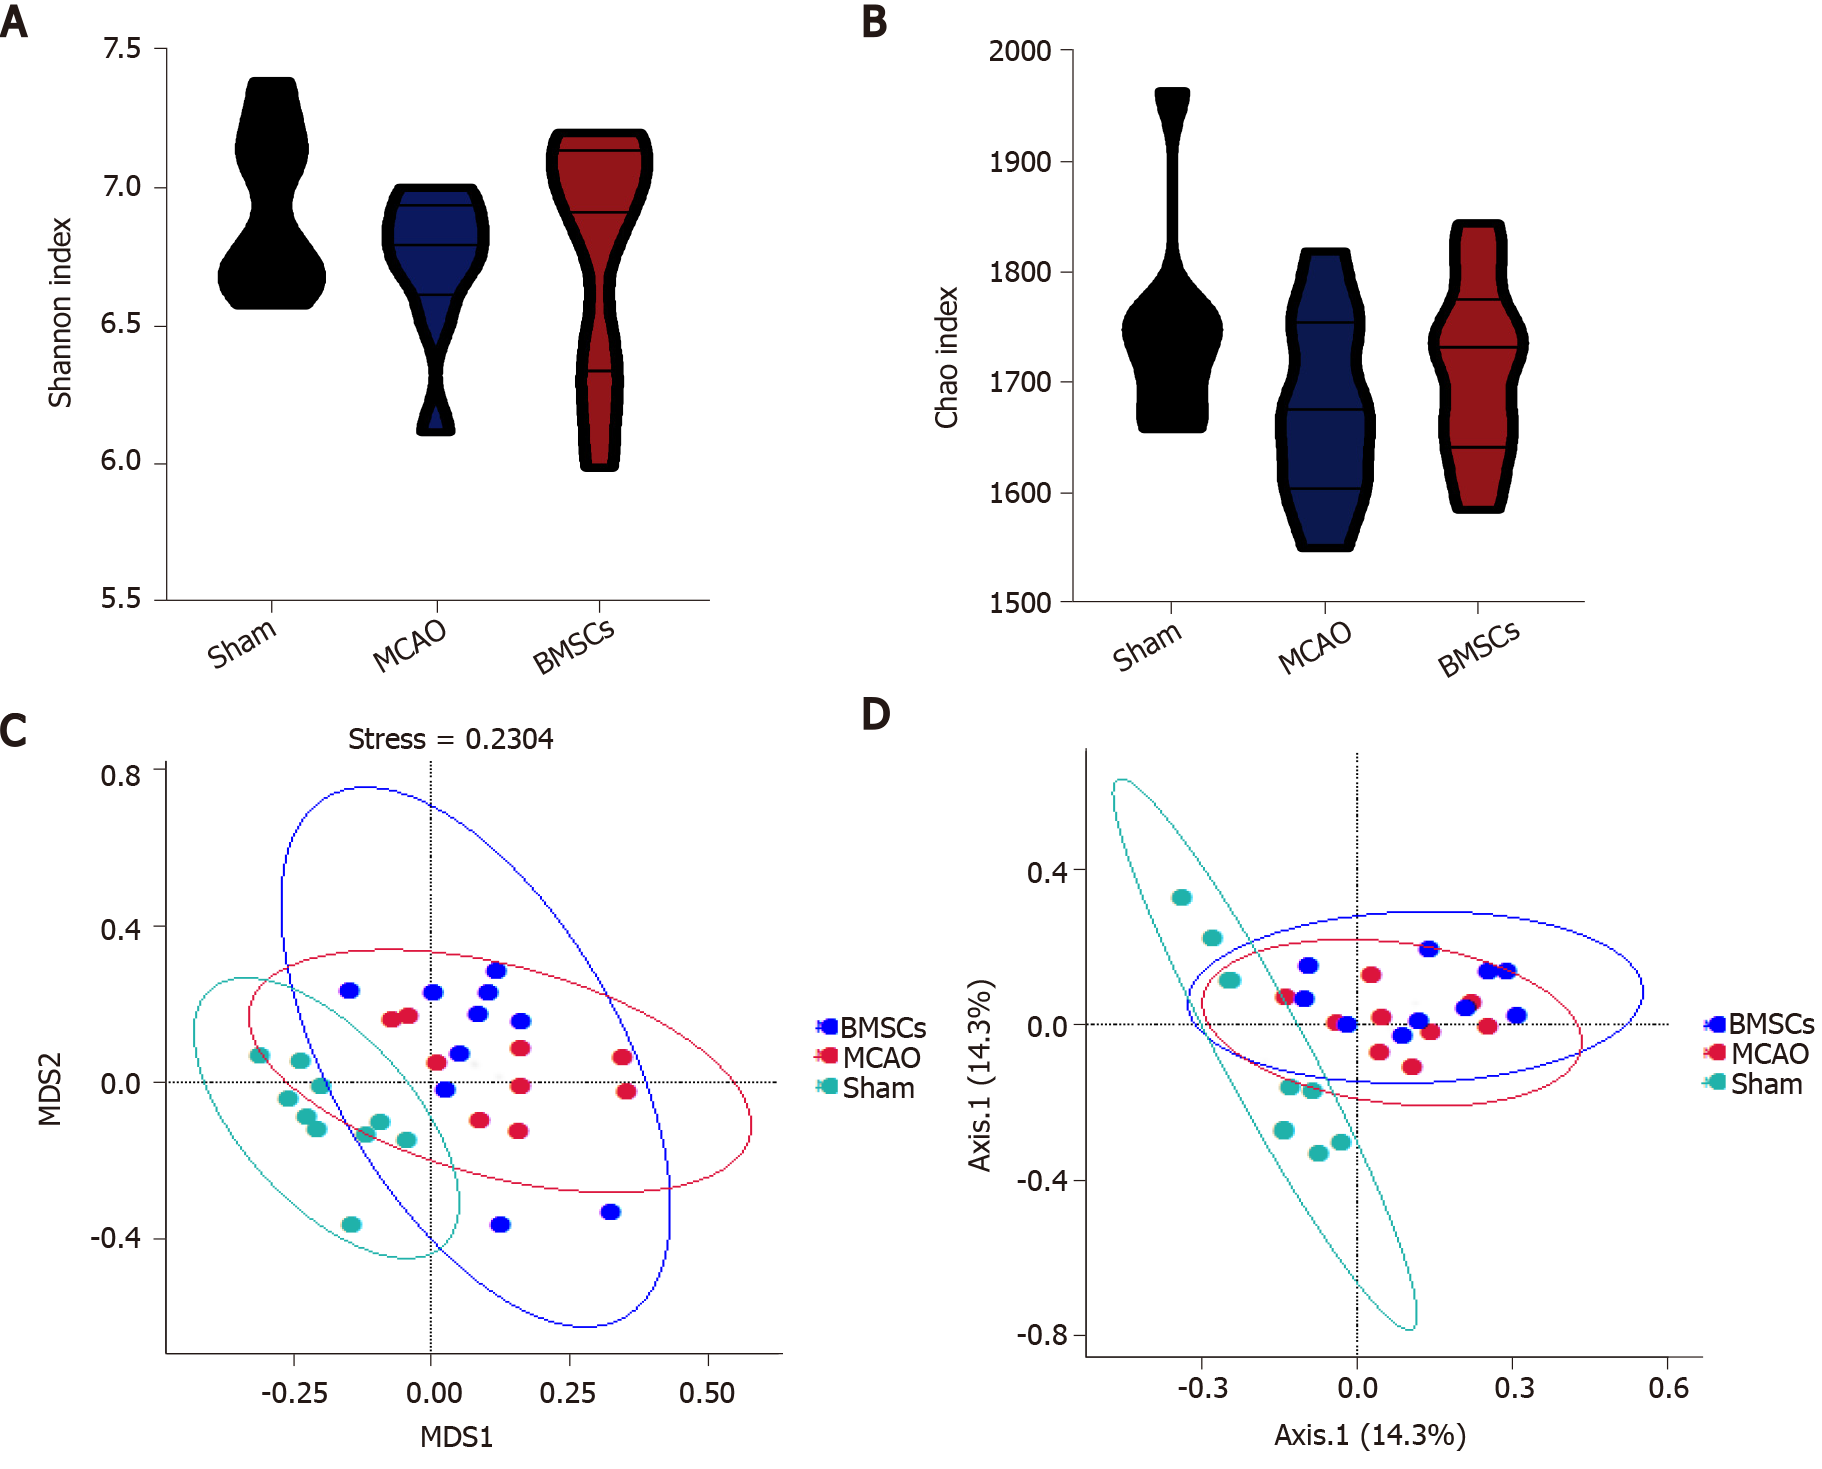
Figure 3 Abundance and structures analysis of intestinal microecology.
A and B: Shannon and Chao index to present α-diversity of gut microbiota; C and D: mNDS and PCoA plot to illustrate the dissimilarities among microbiota structures. BMSCs: Bone marrow mesenchymal stem cells; MCAO: Middle cerebral artery occlusion.
- Citation: Zhao LN, Ma SW, Xiao J, Yang LJ, Xu SX, Zhao L. Bone marrow mesenchymal stem cell therapy regulates gut microbiota to improve post-stroke neurological function recovery in rats. World J Stem Cells 2021; 13(12): 1905-1917
- URL: https://www.wjgnet.com/1948-0210/full/v13/i12/1905.htm
- DOI: https://dx.doi.org/10.4252/wjsc.v13.i12.1905


