Copyright
©The Author(s) 2021.
World J Stem Cells. Nov 26, 2021; 13(11): 1762-1782
Published online Nov 26, 2021. doi: 10.4252/wjsc.v13.i11.1762
Published online Nov 26, 2021. doi: 10.4252/wjsc.v13.i11.1762
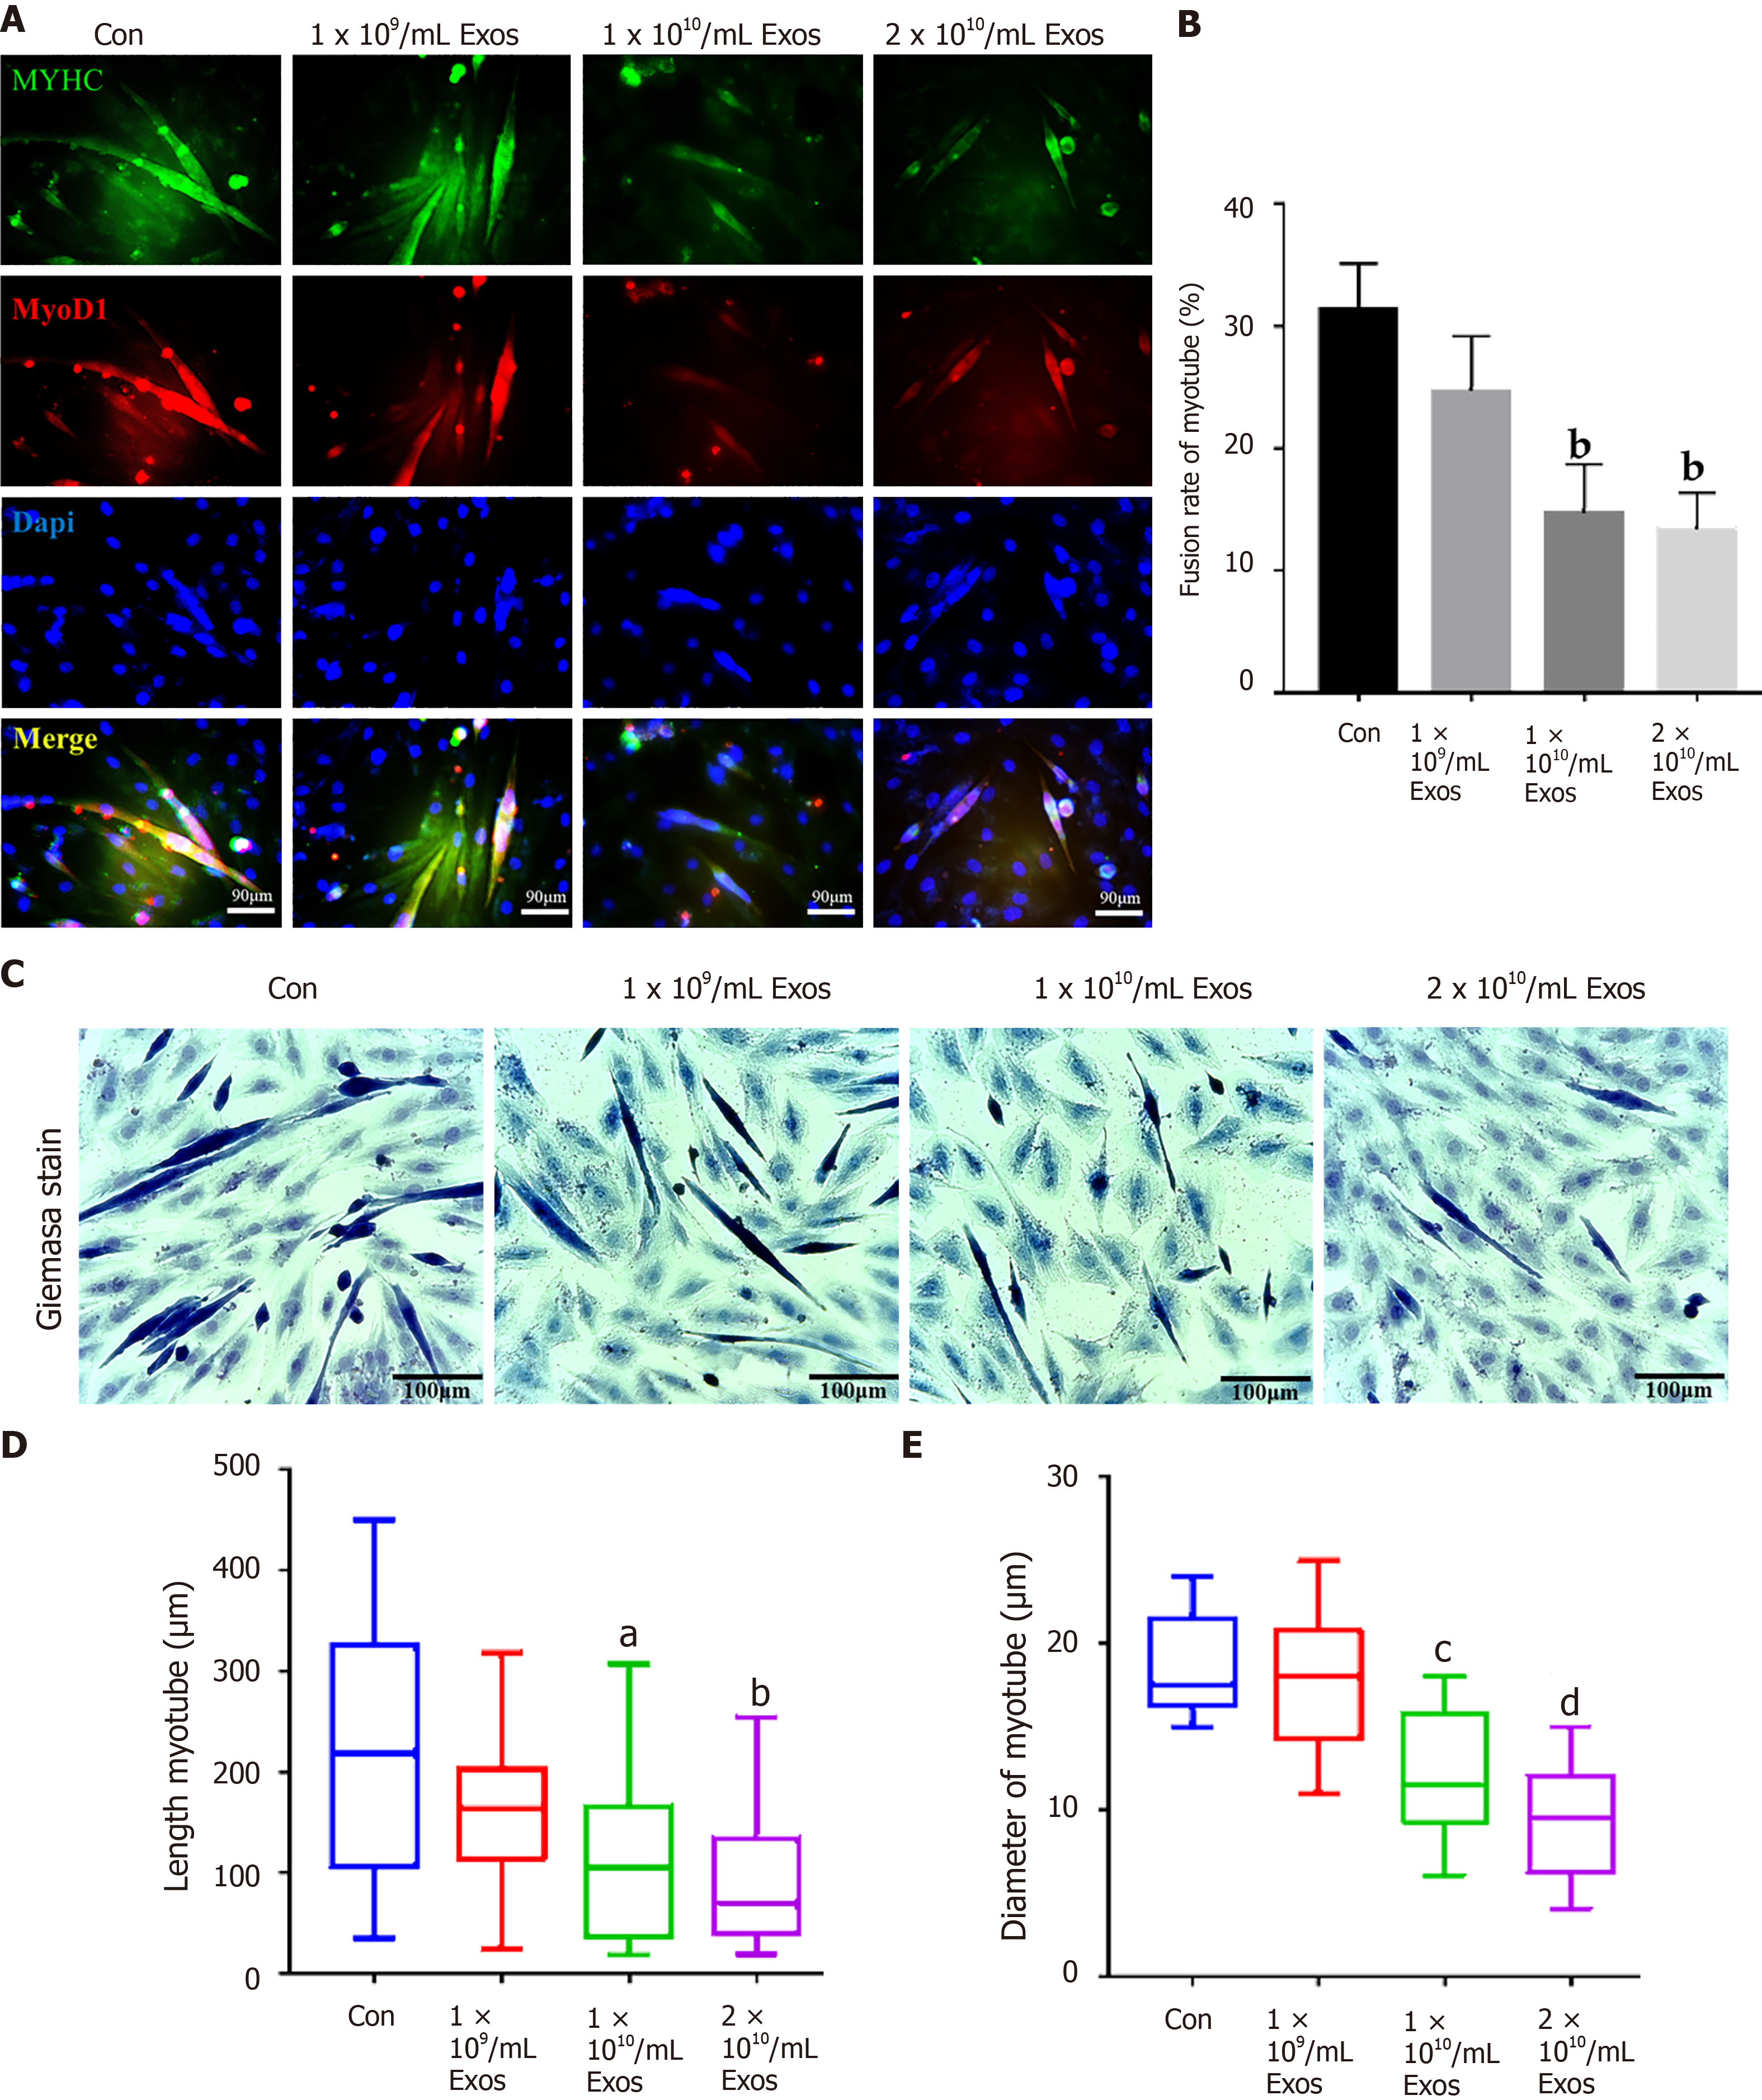
Figure 8 IF-C2C12 Exos impaired C2C12 muscle differentiation in vitro.
A: Immunofluorescence was used to detect relative expression and distribution of MYHC and Myod1 on day 4 after different treatments. Green, red, and blue signals represent MYHC, Myod1, and nucleus, respectively. Scale bar = 90 μm; B, D and E: Quantification of myotube length, diameter, and fusion rate. Data are presented as mean ± SD. n = 12 or 3. aP < 0.05, bP < 0.01, cP < 0.001, dP < 0.0001; C: Representative images of myotube after culture with different concentrations of IF-C2C12-Exosomes for 24 h by Giemsa staining (4 d 2% horse-serum incubation). Scale bar = 100 μmT.
- Citation: Luo ZW, Sun YY, Lin JR, Qi BJ, Chen JW. Exosomes derived from inflammatory myoblasts promote M1 polarization and break the balance of myoblast proliferation/differentiation. World J Stem Cells 2021; 13(11): 1762-1782
- URL: https://www.wjgnet.com/1948-0210/full/v13/i11/1762.htm
- DOI: https://dx.doi.org/10.4252/wjsc.v13.i11.1762


