Copyright
©The Author(s) 2020.
World J Stem Cells. Dec 26, 2020; 12(12): 1591-1602
Published online Dec 26, 2020. doi: 10.4252/wjsc.v12.i12.1591
Published online Dec 26, 2020. doi: 10.4252/wjsc.v12.i12.1591
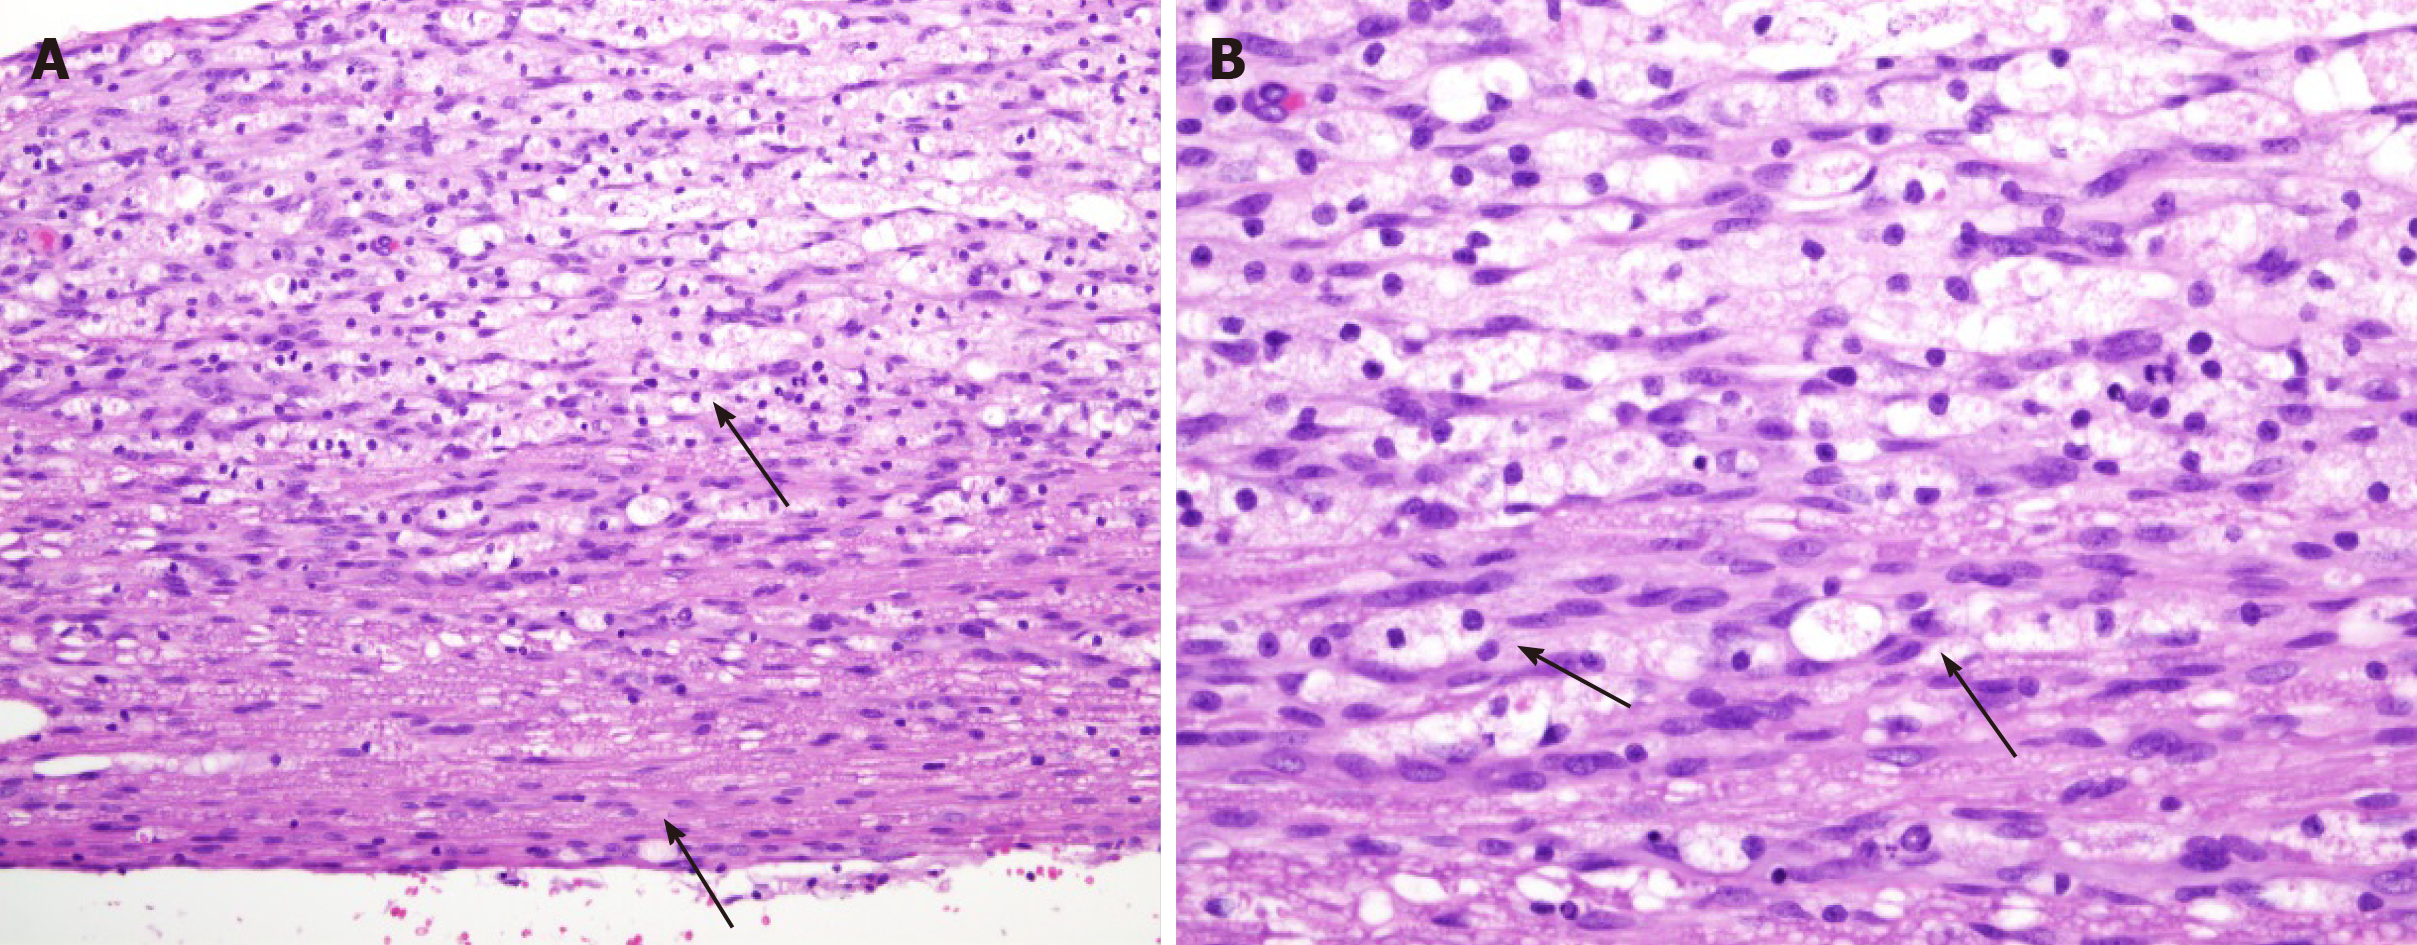
Figure 4 Control group showing minimum gliosis.
A: H&E × 200; B: H&E × 400. Highlighted by a single arrow.
- Citation: Sadat-Ali M, Al-Dakheel DA, Ahmed A, Al-Turki HA, Al-Omran AS, Acharya S, Al-Bayat MI. Spinal cord injury regeneration using autologous bone marrow-derived neurocytes and rat embryonic stem cells: A comparative study in rats. World J Stem Cells 2020; 12(12): 1591-1602
- URL: https://www.wjgnet.com/1948-0210/full/v12/i12/1591.htm
- DOI: https://dx.doi.org/10.4252/wjsc.v12.i12.1591


