Copyright
©The Author(s) 2020.
World J Stem Cells. Nov 26, 2020; 12(11): 1377-1395
Published online Nov 26, 2020. doi: 10.4252/wjsc.v12.i11.1377
Published online Nov 26, 2020. doi: 10.4252/wjsc.v12.i11.1377
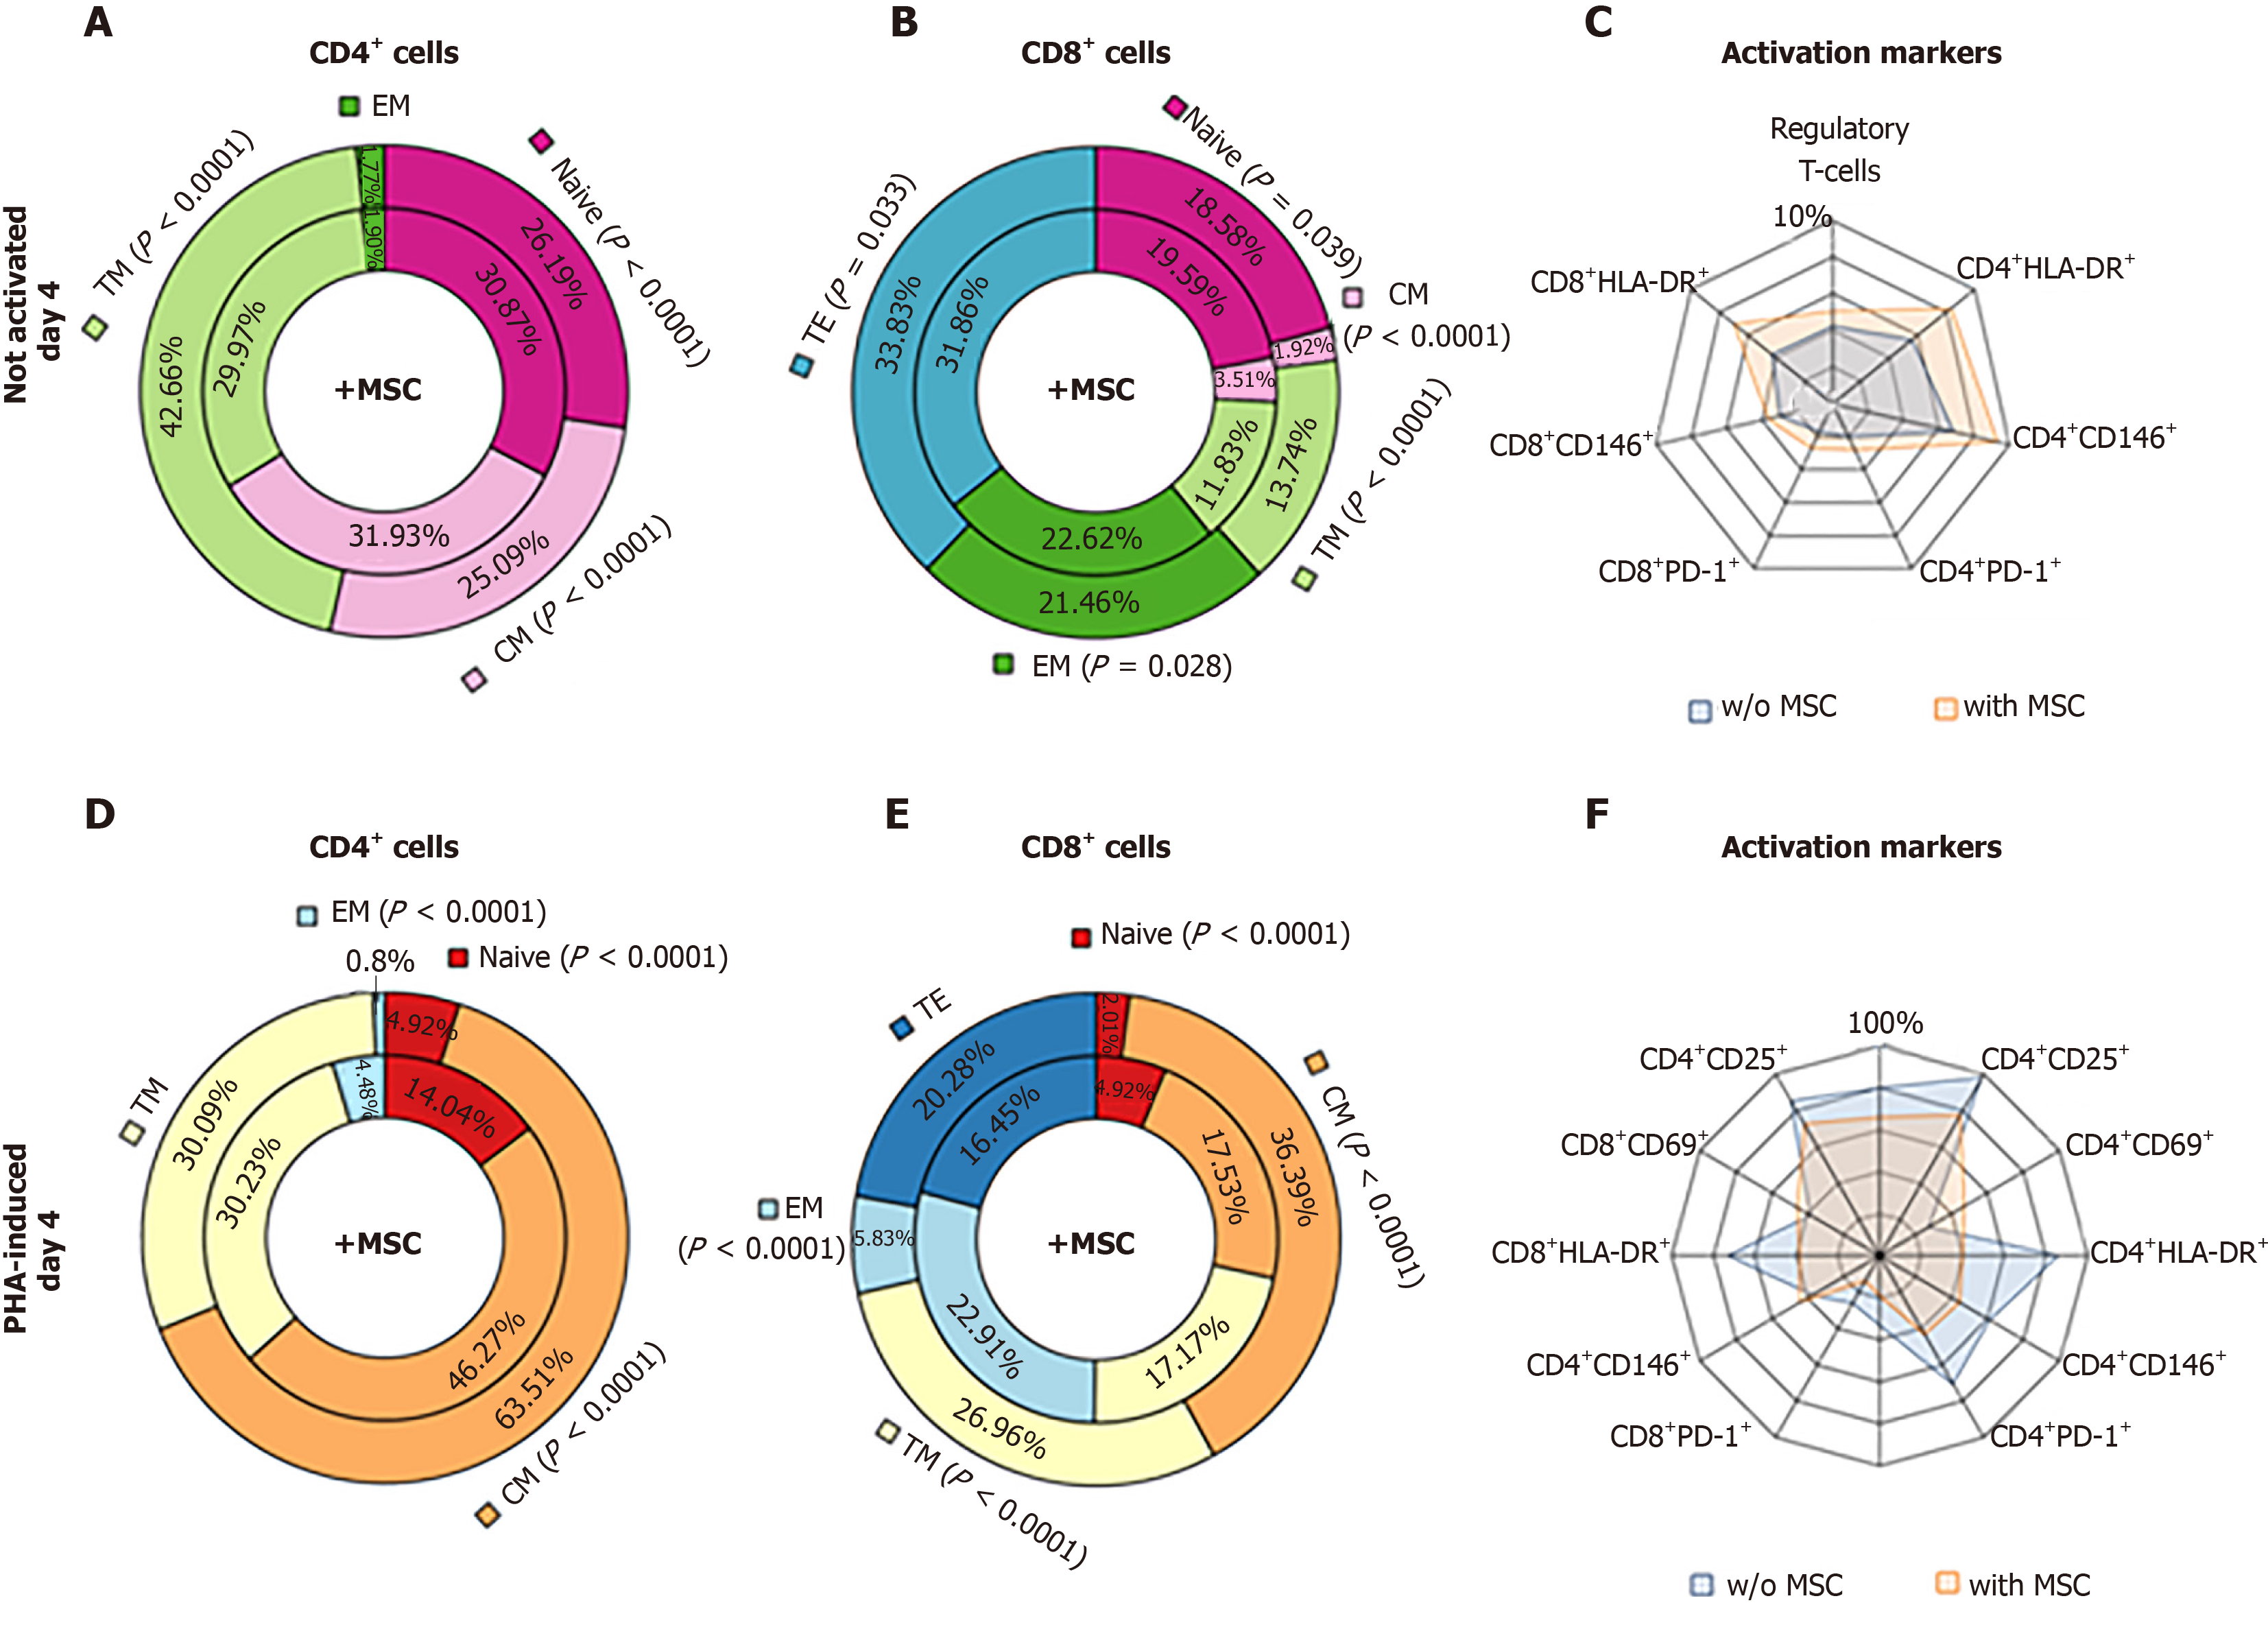
Figure 4 The relative number of the different subpopulations of lymphocytes after 4 d of cultivation with multipotent mesenchymal stromal cells.
A-C: Among the cultures of non-activated lymphocytes; D-F: Among the PHA-activated lymphocytes. The subpopulation fractions in the outer rings (on graphs A, B, D, E) correspond to control lymphocytes, and the internal fractions correspond to lymphocytes co-cultivated with multipotent mesenchymal stromal cells (MSCs). C and F show the relative number of lymphocytes expressing different activation markers (blue areas are lymphocyte cultures, and orange areas are lymphocyte cultures with MSCs). MSCs: Multipotent mesenchymal stromal cells.
- Citation: Petinati N, Kapranov N, Davydova Y, Bigildeev A, Pshenichnikova O, Karpenko D, Drize N, Kuzmina L, Parovichnikova E, Savchenko V. Immunophenotypic characteristics of multipotent mesenchymal stromal cells that affect the efficacy of their use in the prevention of acute graft vs host disease. World J Stem Cells 2020; 12(11): 1377-1395
- URL: https://www.wjgnet.com/1948-0210/full/v12/i11/1377.htm
- DOI: https://dx.doi.org/10.4252/wjsc.v12.i11.1377


