Copyright
©The Author(s) 2020.
World J Stem Cells. Nov 26, 2020; 12(11): 1366-1376
Published online Nov 26, 2020. doi: 10.4252/wjsc.v12.i11.1366
Published online Nov 26, 2020. doi: 10.4252/wjsc.v12.i11.1366
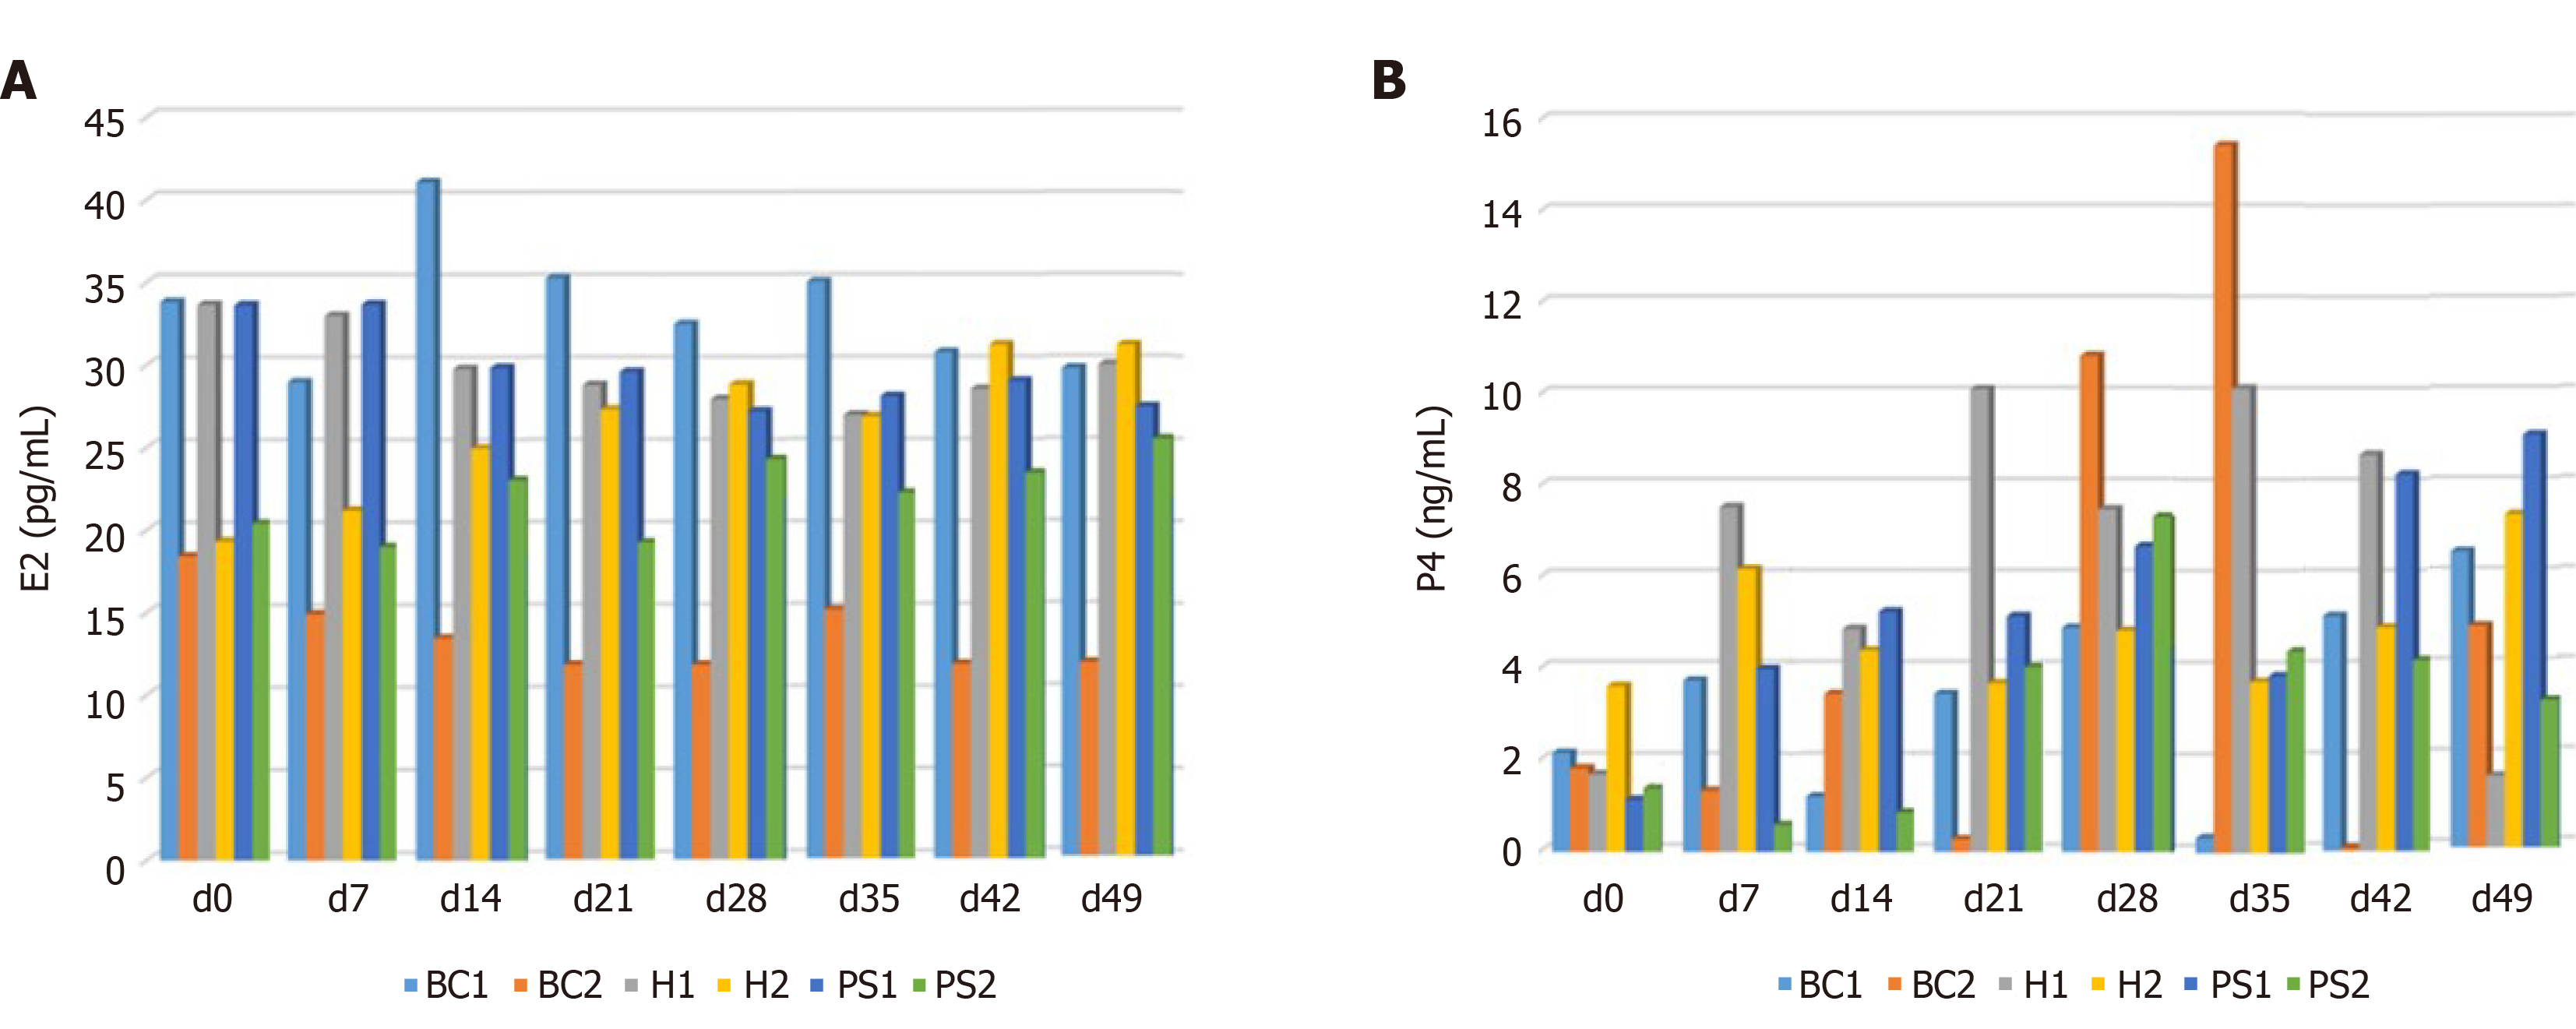
Figure 6 Comparison of estradiol and progesterone concentrations in each group.
A: All hormone and cattle placental stem cell (CPSC) treatment groups had no significant difference that might originate from individual variations; B: Concentration of progesterone (P4) increased in the hormone and CPSC treatment groups, but the elevation was unstable due to individual variations. BC1: Control group; BC2: Placebo group with follicular fluid drainage and saline injection; H1: Gonadotrophin-releasing hormone (GnRH) (250 μg)-prostaglandin (PG) (500 μg)-GnRH (250 μg) hormone treatment group without drainage of follicular fluid; H2: Hormone treatment group with drainage of follicular fluid; PS1: CPSC treatment group with follicular fluid drainage and ovarian injection of 1 × 10⁶ CPSCs; PS2: CPSC treatment group with follicular fluid drainage and ovarian injection of 1× 10⁶ CPSCs; E2: Estradiol.
- Citation: Peng SY, Wu TH, Lin TY, Hii LY, Chan KS, Fu TY, Chang SC, Shen PC, Liu KY, Shaw SW.. Application of cattle placental stem cells for treating ovarian follicular cyst. World J Stem Cells 2020; 12(11): 1366-1376
- URL: https://www.wjgnet.com/1948-0210/full/v12/i11/1366.htm
- DOI: https://dx.doi.org/10.4252/wjsc.v12.i11.1366


