Copyright
©The Author(s) 2020.
World J Stem Cells. Oct 26, 2020; 12(10): 1171-1183
Published online Oct 26, 2020. doi: 10.4252/wjsc.v12.i10.1171
Published online Oct 26, 2020. doi: 10.4252/wjsc.v12.i10.1171
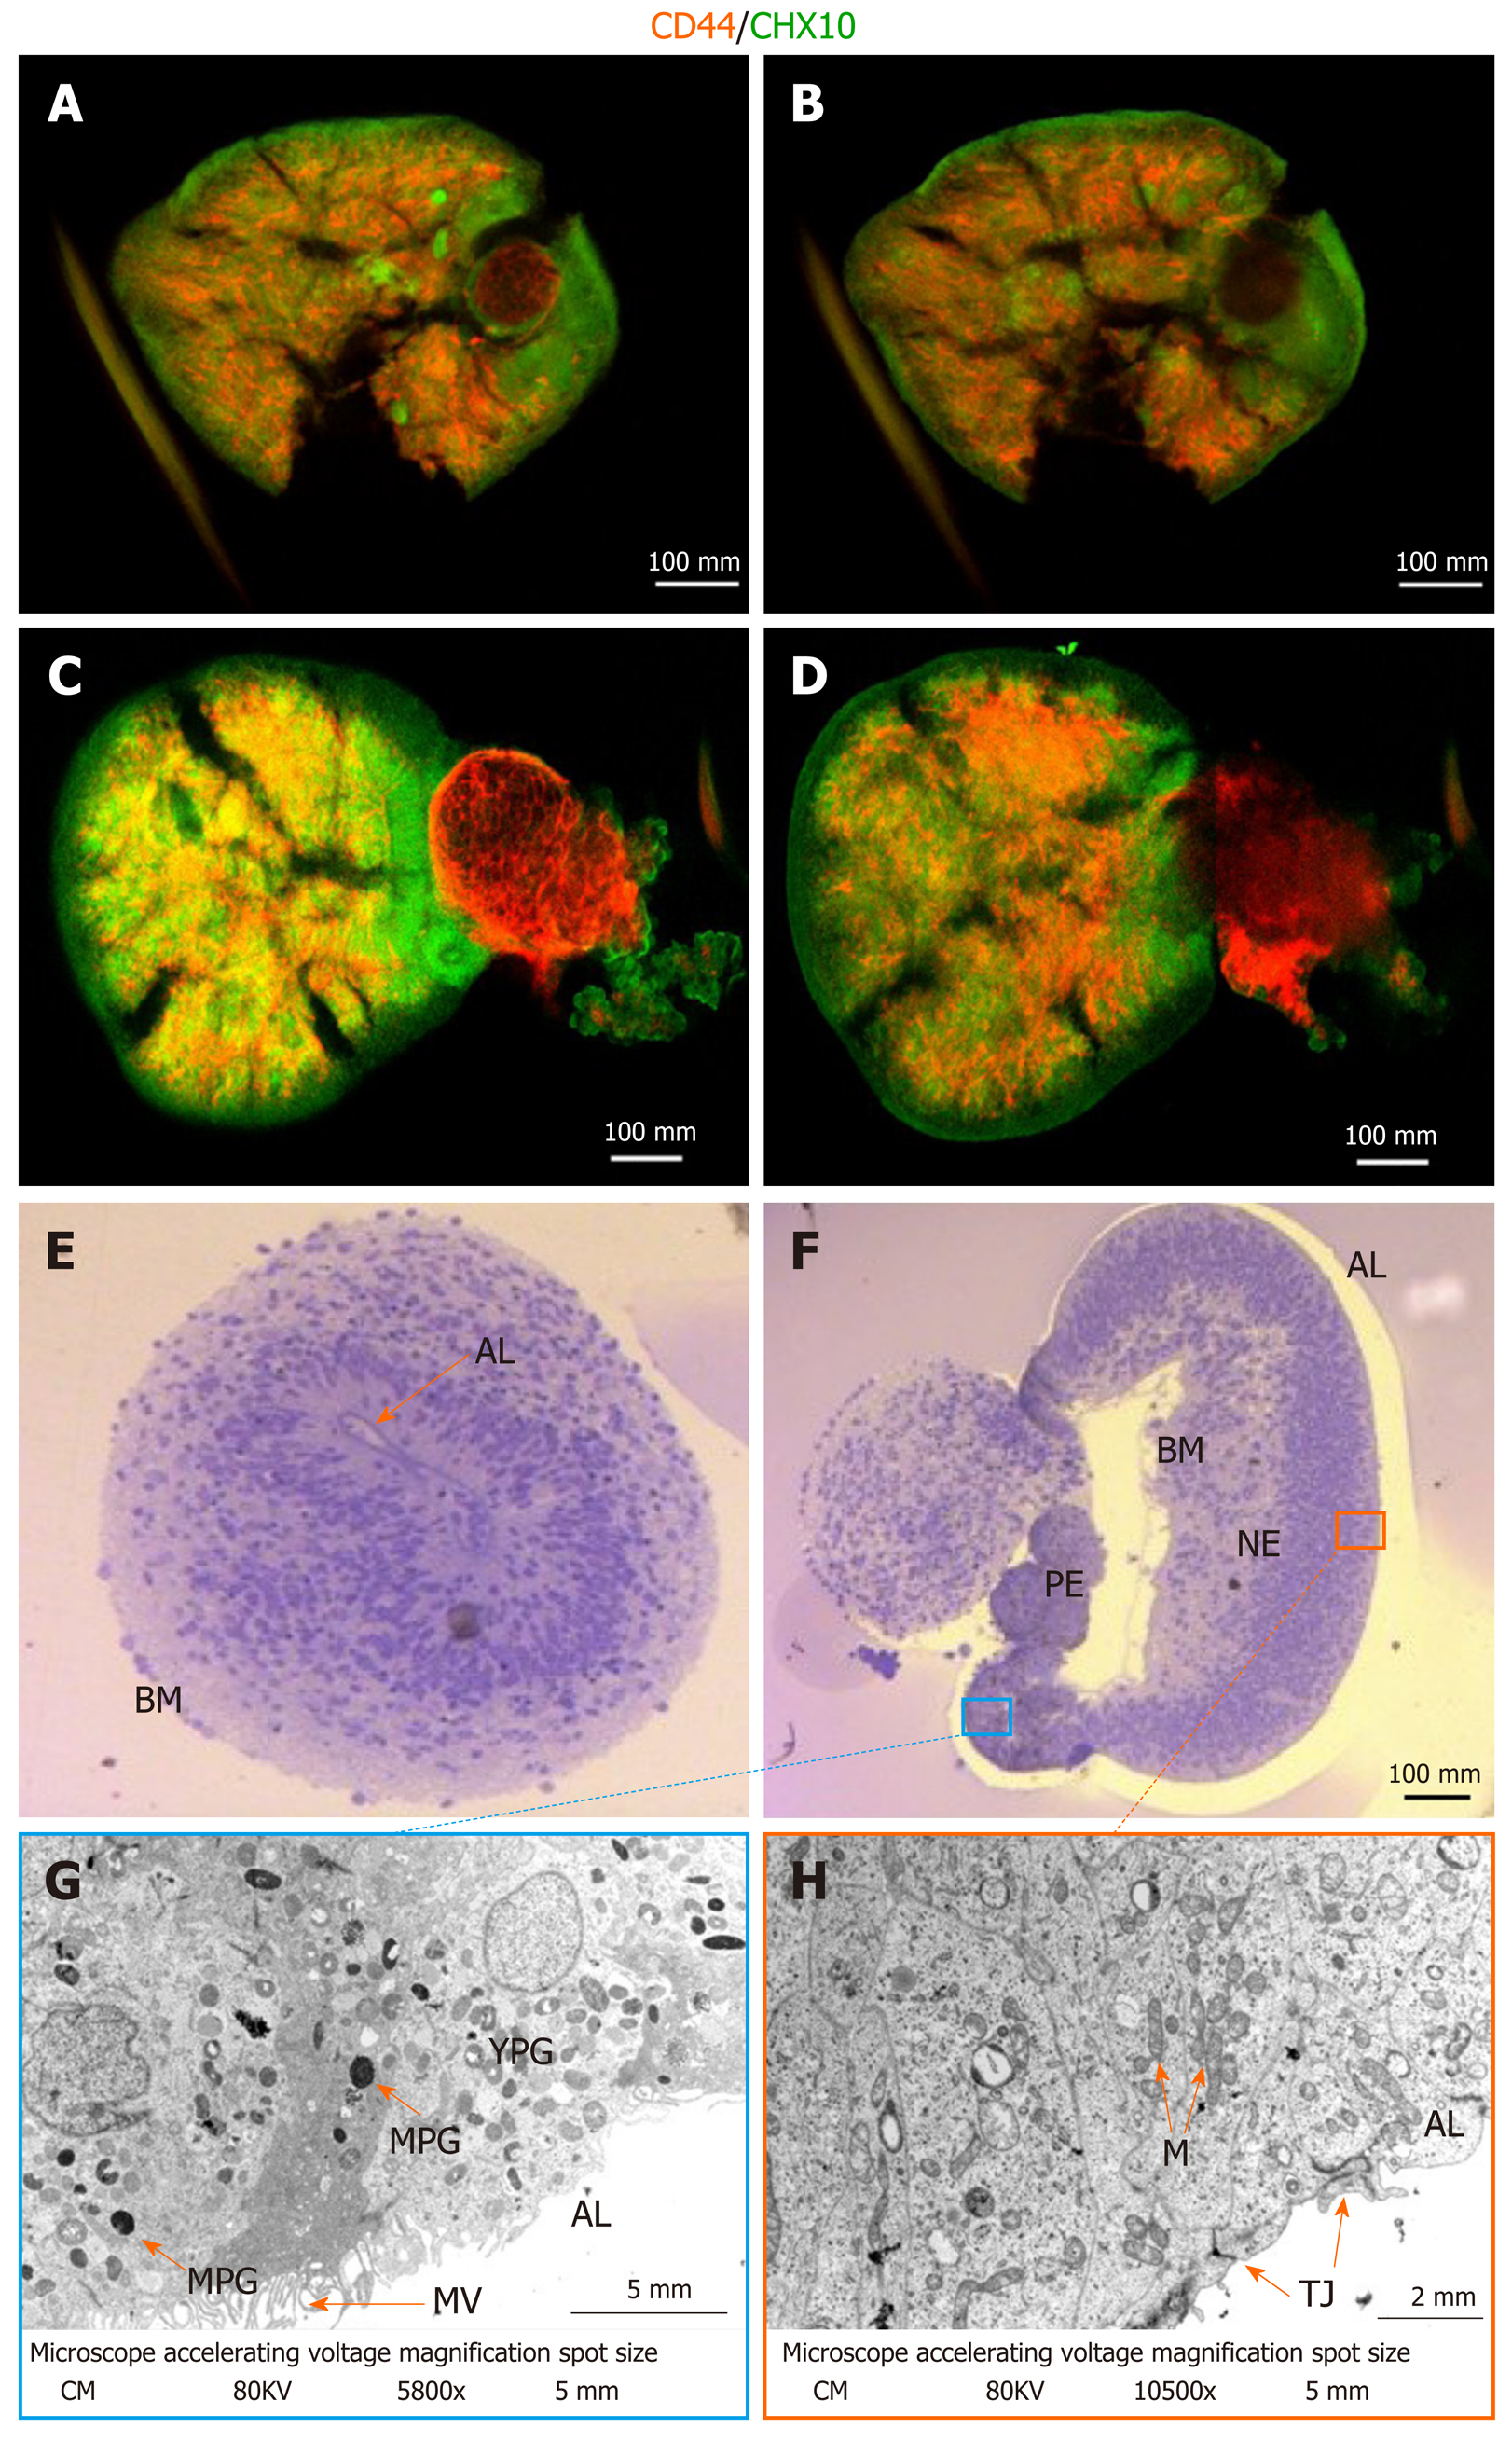
Figure 2 Assessment of maturity and cellular composition of day 56 retinal organoids.
A: Retinal organoids (RGs) after ethyl cinnamate clearing following whole-mount ICC for CHX10 (green) and CD44 (red) showing a more superficial layer of the structure; B: Proximal-most layer of OC seen in (A), clearly showing cells expressing CD44 and CHX10 in a non-overlapping but intercalated manner; C and D: Different RGs treated identically to (AB) showing similar distribution of retinal ganglion cells (RGCs) (CHX10-labelled) and Müller glia (CD44-labelled); E: Bright-field (BF) image of RG not showing invagination with the basal membrane (BM) outside. The apical layer (AL) is visible; F: BF image of invaginated RGs with BM inside (inverted). Visible are the retinal pigmented epithelium (RPE), retinal neural epithelium (RNE) and AL; G: Transmission electron microscopy (TEM) of the RPE. Visible are the AL with microvilli, mature pigmented granules and immature/young pigmented granules; H: TEM of the RNE with tight junctions at the AL and high density of mitochondria characteristic of neural tissues. Scale bar represents 100 mm as applies to A-F. Scale bar for G is 5 mm and 2 mm for H. AL: Apical layer; BM: Basal membrane; M: Mitochondria; MPG: Mature pigmented granules; MV: Microvilli; NE: Neural epithelium; TJ: Tight junctions.
-
Citation: Freude KK, Saruhanian S, McCauley A, Paterson C, Odette M, Oostenink A, Hyttel P, Gillies M, Haukedal H, Kolko M. Enrichment of retinal ganglion and Müller glia progenitors from retinal organoids derived from human induced pluripotent stem
cells - possibilities and current limitations. World J Stem Cells 2020; 12(10): 1171-1183 - URL: https://www.wjgnet.com/1948-0210/full/v12/i10/1171.htm
- DOI: https://dx.doi.org/10.4252/wjsc.v12.i10.1171


