Copyright
©The Author(s) 2019.
World J Stem Cells. Feb 26, 2019; 11(2): 100-123
Published online Feb 26, 2019. doi: 10.4252/wjsc.v11.i2.100
Published online Feb 26, 2019. doi: 10.4252/wjsc.v11.i2.100
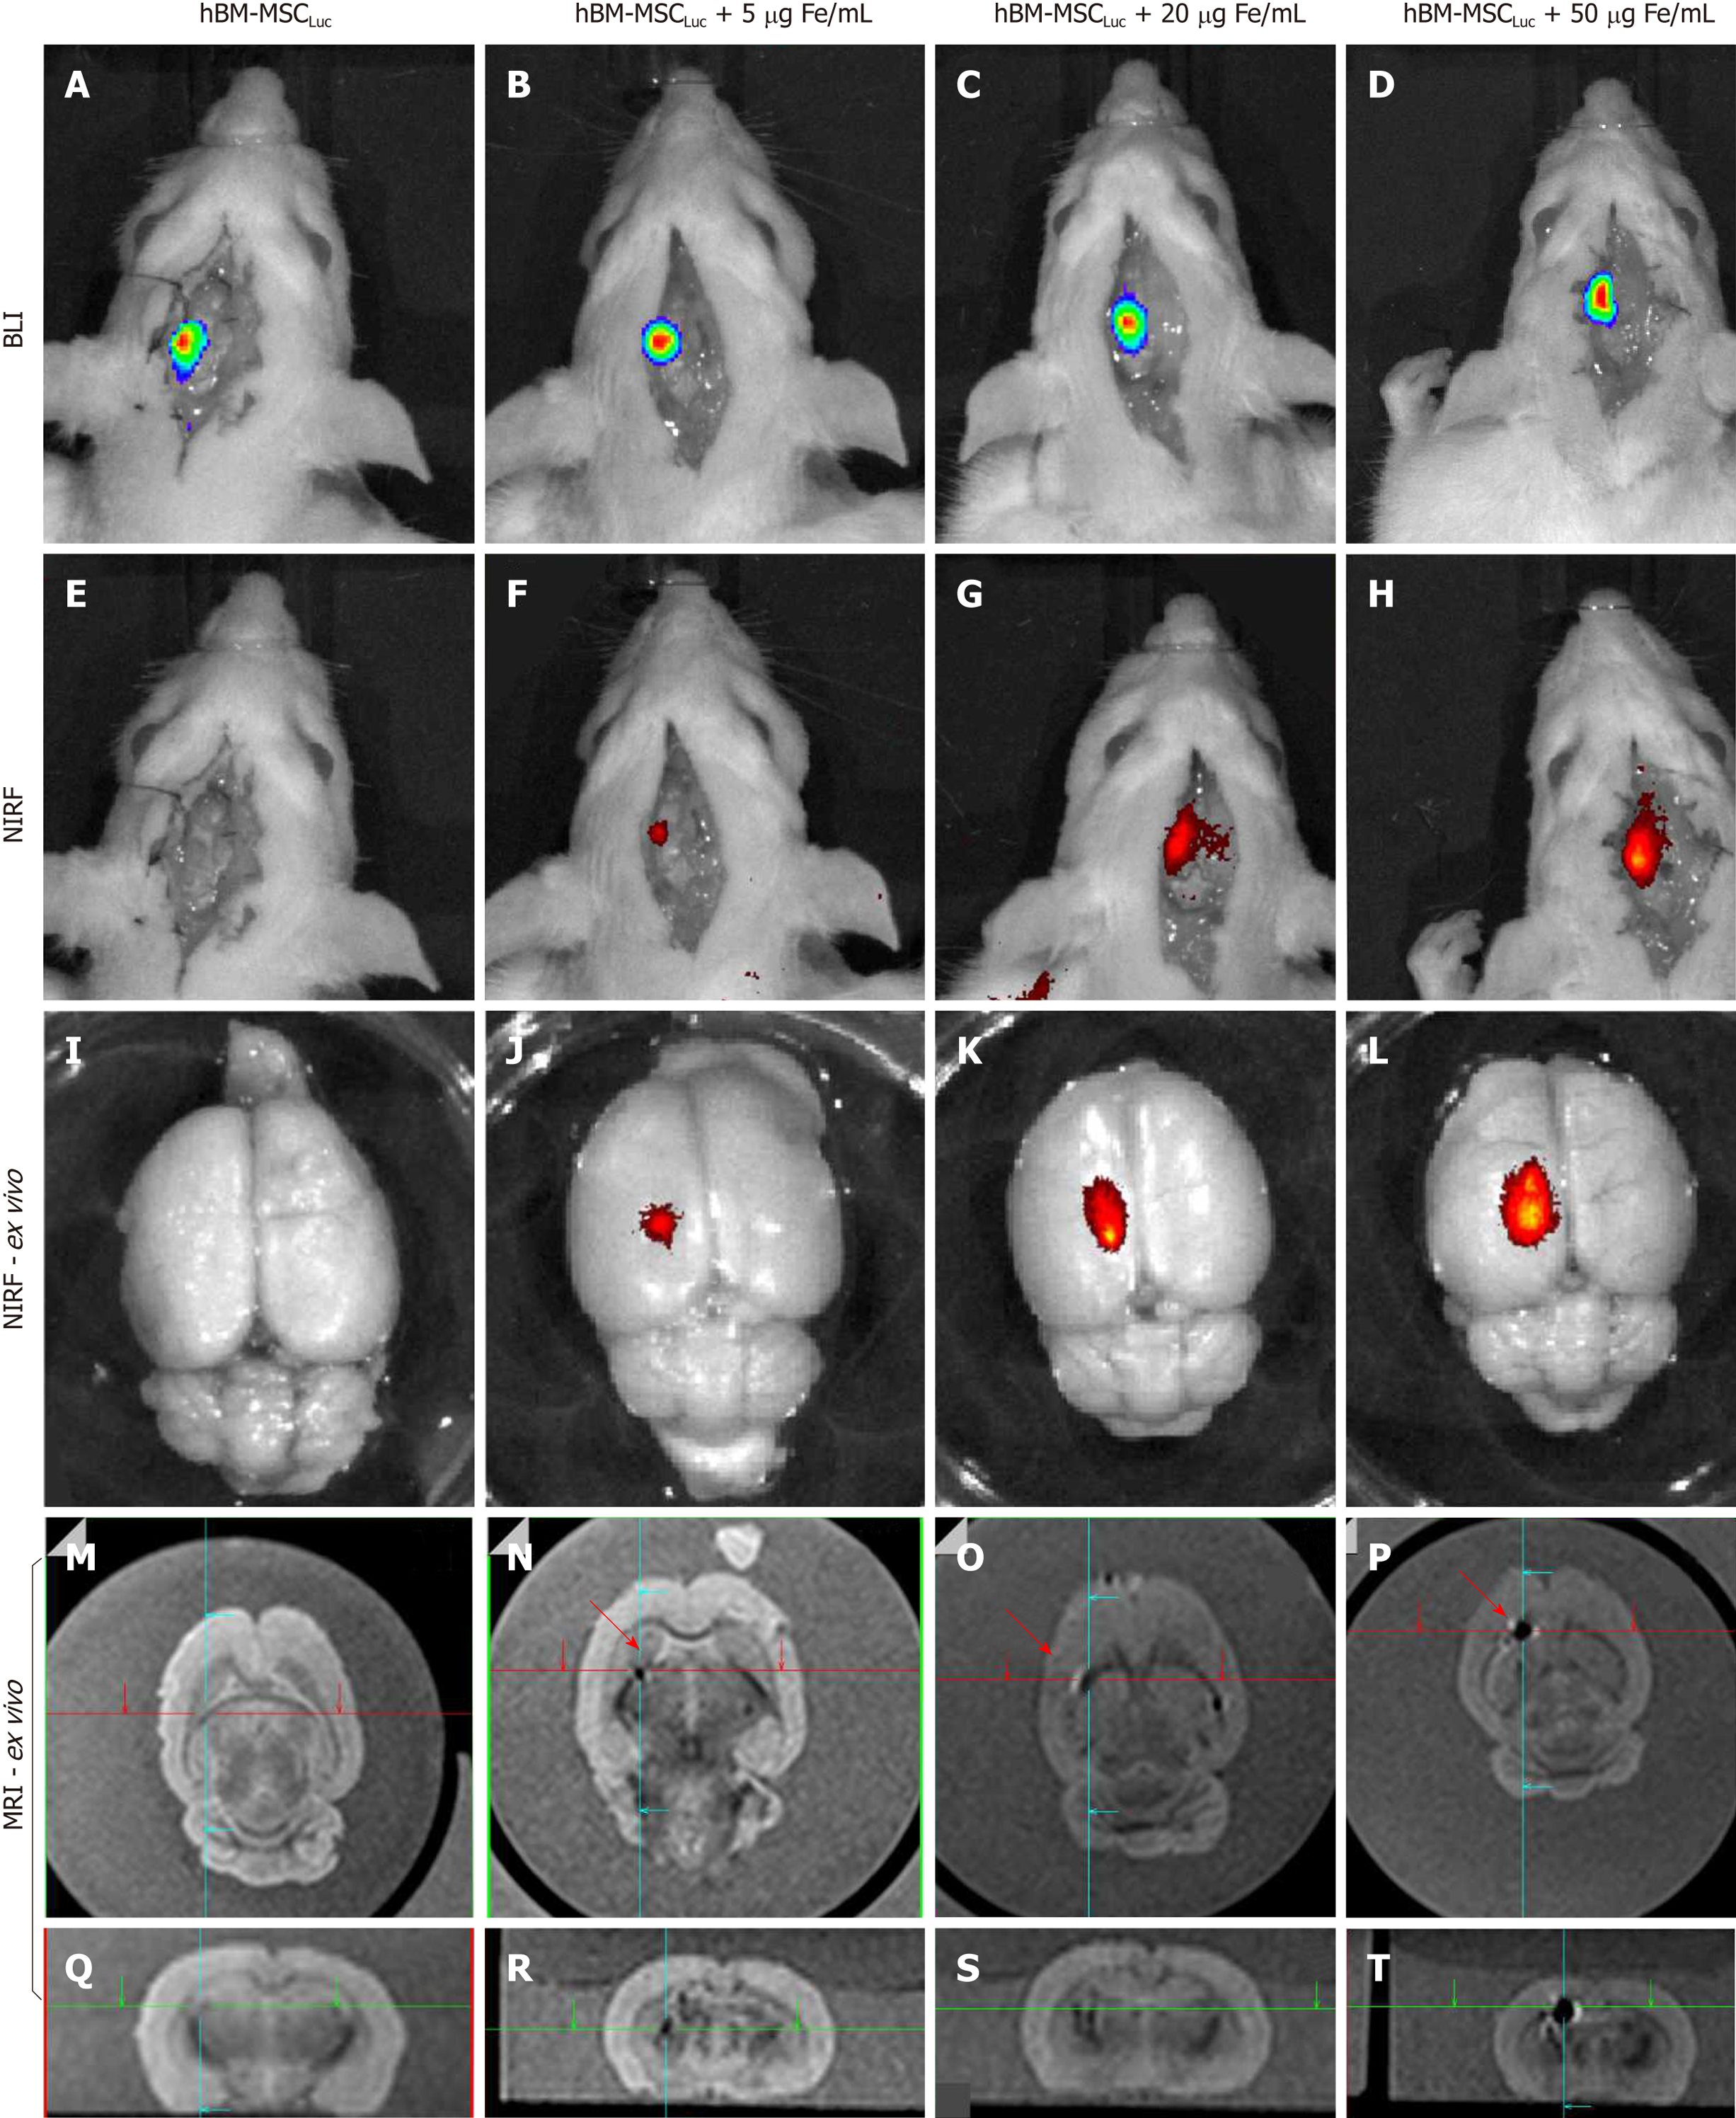
Figure 7 Evaluation of bioluminescent images, near-infrared fluorescence, and magnetic resonance imaging signals of labeled human bone marrow mesenchymal stem cellsLuc implanted in animals (sham groups).
A: BLI image of the sham_control group after luciferin addition; B-D: BLI images after luciferin addition in the sham_S5, sham_S20 and sham_S50 groups; E: NIRF image of the sham_control group; F-H: NIRF images of the sham_S5, sham_S20 and sham_S50 groups; I, L: ex vivo NIRF images of all groups; M-Q: Sagittal and coronal MRI of the sham_control group; N-P: Sagittal MRI of the sham_s5, sham_s20 and sham_S50 groups, showing the position of iron signal detection with red arrows; R-T: Coronal MRI of the sham_s5, sham_s20 and sham_S50 groups, showing the position of iron signal detection with crossing green lines. (n = 7 rats/group). BLI: Bioluminescent images; hBM-MSC: Human bone marrow mesenchymal stem cells; NIRF: Near-infrared fluorescence; MRI: Magnetic resonance imaging.
- Citation: da Silva HR, Mamani JB, Nucci MP, Nucci LP, Kondo AT, Fantacini DMC, de Souza LEB, Picanço-Castro V, Covas DT, Kutner JM, de Oliveira FA, Hamerschlak N, Gamarra LF. Triple-modal imaging of stem-cells labeled with multimodal nanoparticles, applied in a stroke model. World J Stem Cells 2019; 11(2): 100-123
- URL: https://www.wjgnet.com/1948-0210/full/v11/i2/100.htm
- DOI: https://dx.doi.org/10.4252/wjsc.v11.i2.100


