Copyright
©The Author(s) 2019.
World J Stem Cells. Nov 26, 2019; 11(11): 990-1004
Published online Nov 26, 2019. doi: 10.4252/wjsc.v11.i11.990
Published online Nov 26, 2019. doi: 10.4252/wjsc.v11.i11.990
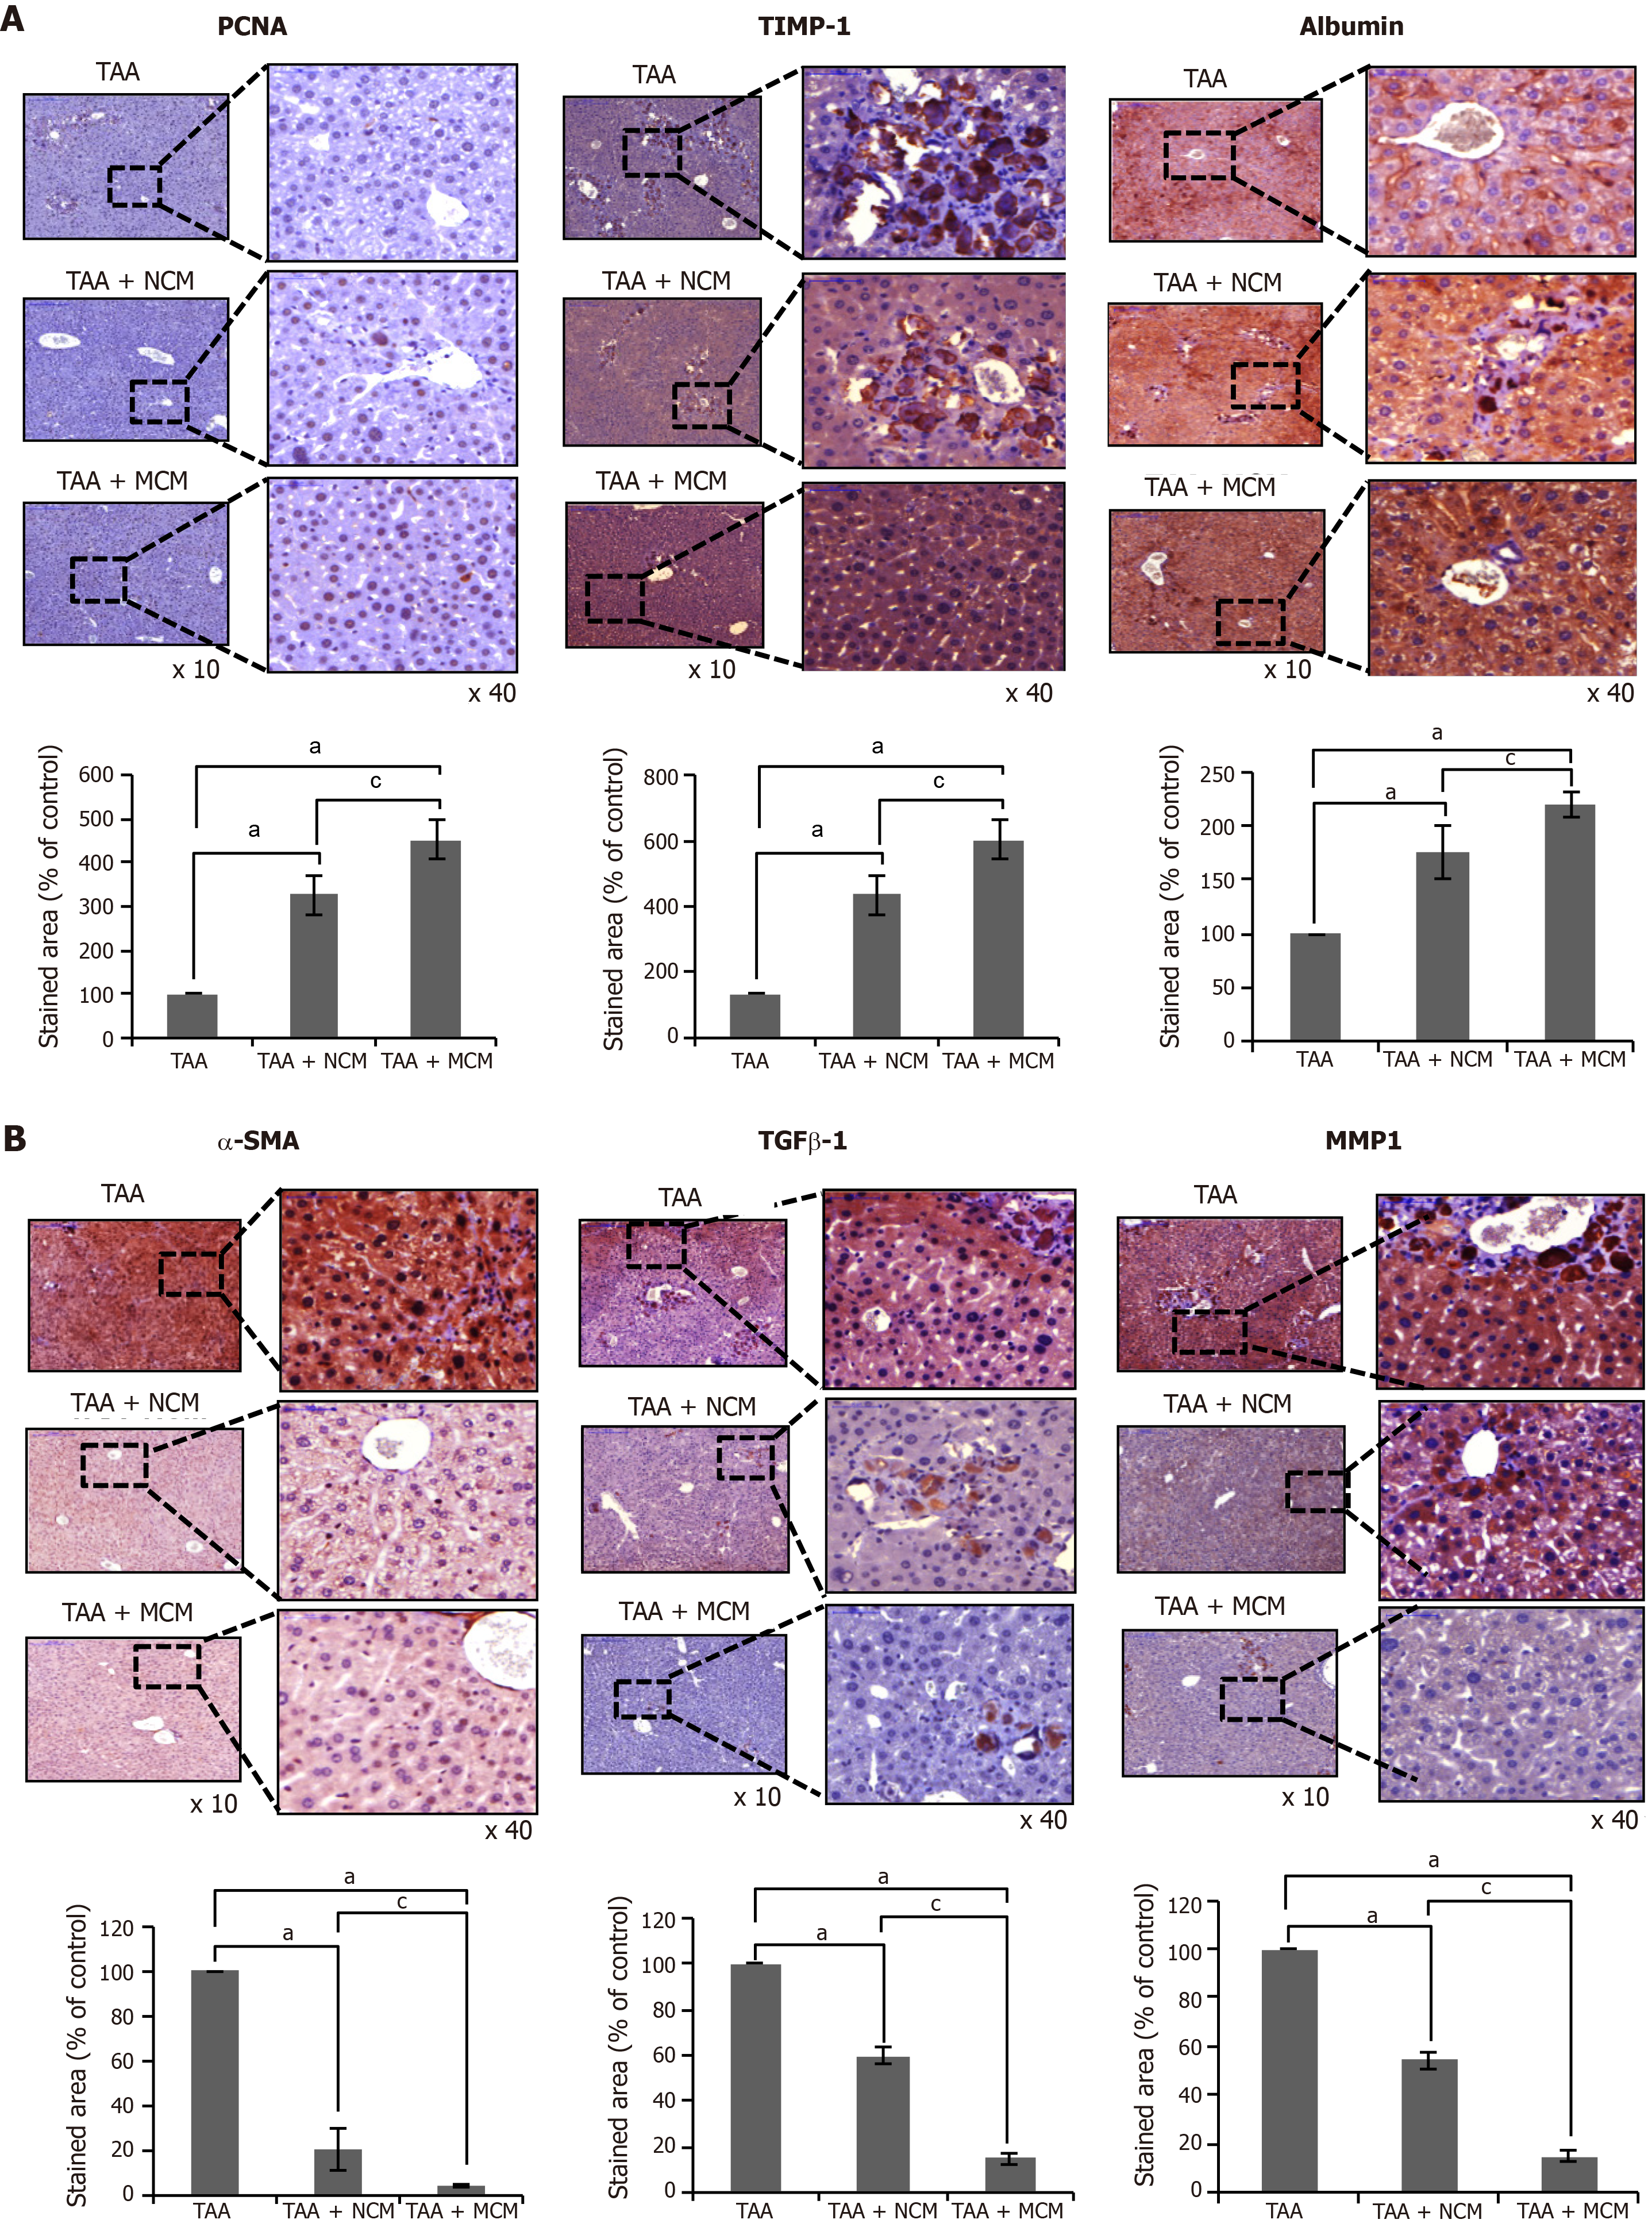
Figure 4 Immunohistochemical staining showing the effects of MCM on the expression of inflammatory and fibrotic markers in the livers.
A, B: Upon comparing immunohistochemical staining patterns, MCM infusion led to higher expression of PCNA (an inflammatory marker), albumin, and TIMP-1 (an antifibrotic marker) A, and lower expression of α-SMA, TGF-β1, and MMP1 (fibrotic markers) B in the livers of TAA-treated mice. Percentages of immunoreactive areas were measured using NIH image J and expressed as relative values to those in normal livers. Magnification × 400. Values are presented as mean ± standard deviation of three independent experiments. aP < 0.05 vs Ct (TAA). cP < 0.05 between TAA + NCM and TAA + MCM. α-SMA: Alpha-smooth muscle actin; Ct: Control; CM: The secretome obtained from ASCs after 48-h-incubation; MCM: The secretome released from miR-122-transfected ASCs; MMP-1: Metalloproteinases-1; PCNA: Proliferating cell nuclear antigen; TAA: Thioacetamide; TGF-β: Transforming growth factor-β; TIMP-1: Tissue inhibitor of metalloproteinases-1.
- Citation: Kim KH, Lee JI, Kim OH, Hong HE, Kwak BJ, Choi HJ, Ahn J, Lee TY, Lee SC, Kim SJ. Ameliorating liver fibrosis in an animal model using the secretome released from miR-122-transfected adipose-derived stem cells. World J Stem Cells 2019; 11(11): 990-1004
- URL: https://www.wjgnet.com/1948-0210/full/v11/i11/990.htm
- DOI: https://dx.doi.org/10.4252/wjsc.v11.i11.990


