Copyright
©The Author(s) 2019.
World J Stem Cells. Oct 26, 2019; 11(10): 891-903
Published online Oct 26, 2019. doi: 10.4252/wjsc.v11.i10.891
Published online Oct 26, 2019. doi: 10.4252/wjsc.v11.i10.891
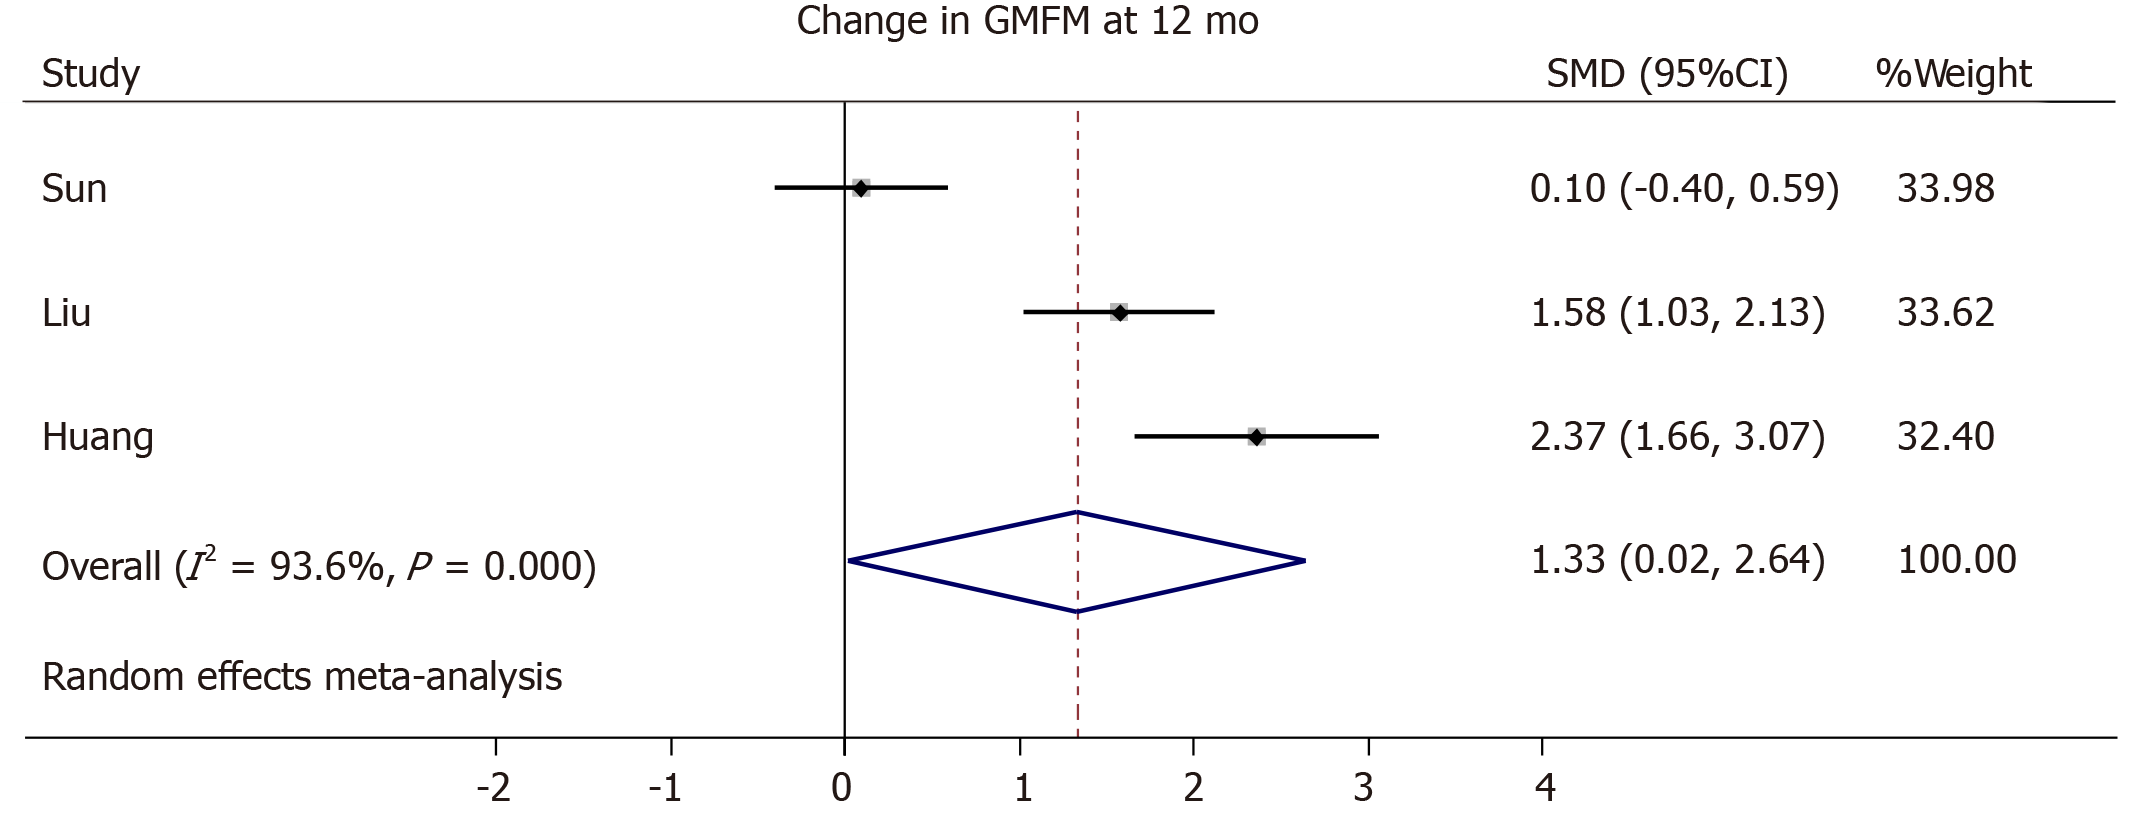
Figure 4 Forest plot showing the effect size of the change in the Gross Motor Function Measure in the intervention group compared to the control group after 12 mo.
GMFM: Gross Motor Function Measure; SMD: Standard mean difference; CI: Confidence interval.
- Citation: Eggenberger S, Boucard C, Schoeberlein A, Guzman R, Limacher A, Surbek D, Mueller M. Stem cell treatment and cerebral palsy: Systemic review and meta-analysis. World J Stem Cells 2019; 11(10): 891-903
- URL: https://www.wjgnet.com/1948-0210/full/v11/i10/891.htm
- DOI: https://dx.doi.org/10.4252/wjsc.v11.i10.891


