Copyright
©The Author(s) 2019.
World J Stem Cells. Oct 26, 2019; 11(10): 859-890
Published online Oct 26, 2019. doi: 10.4252/wjsc.v11.i10.859
Published online Oct 26, 2019. doi: 10.4252/wjsc.v11.i10.859
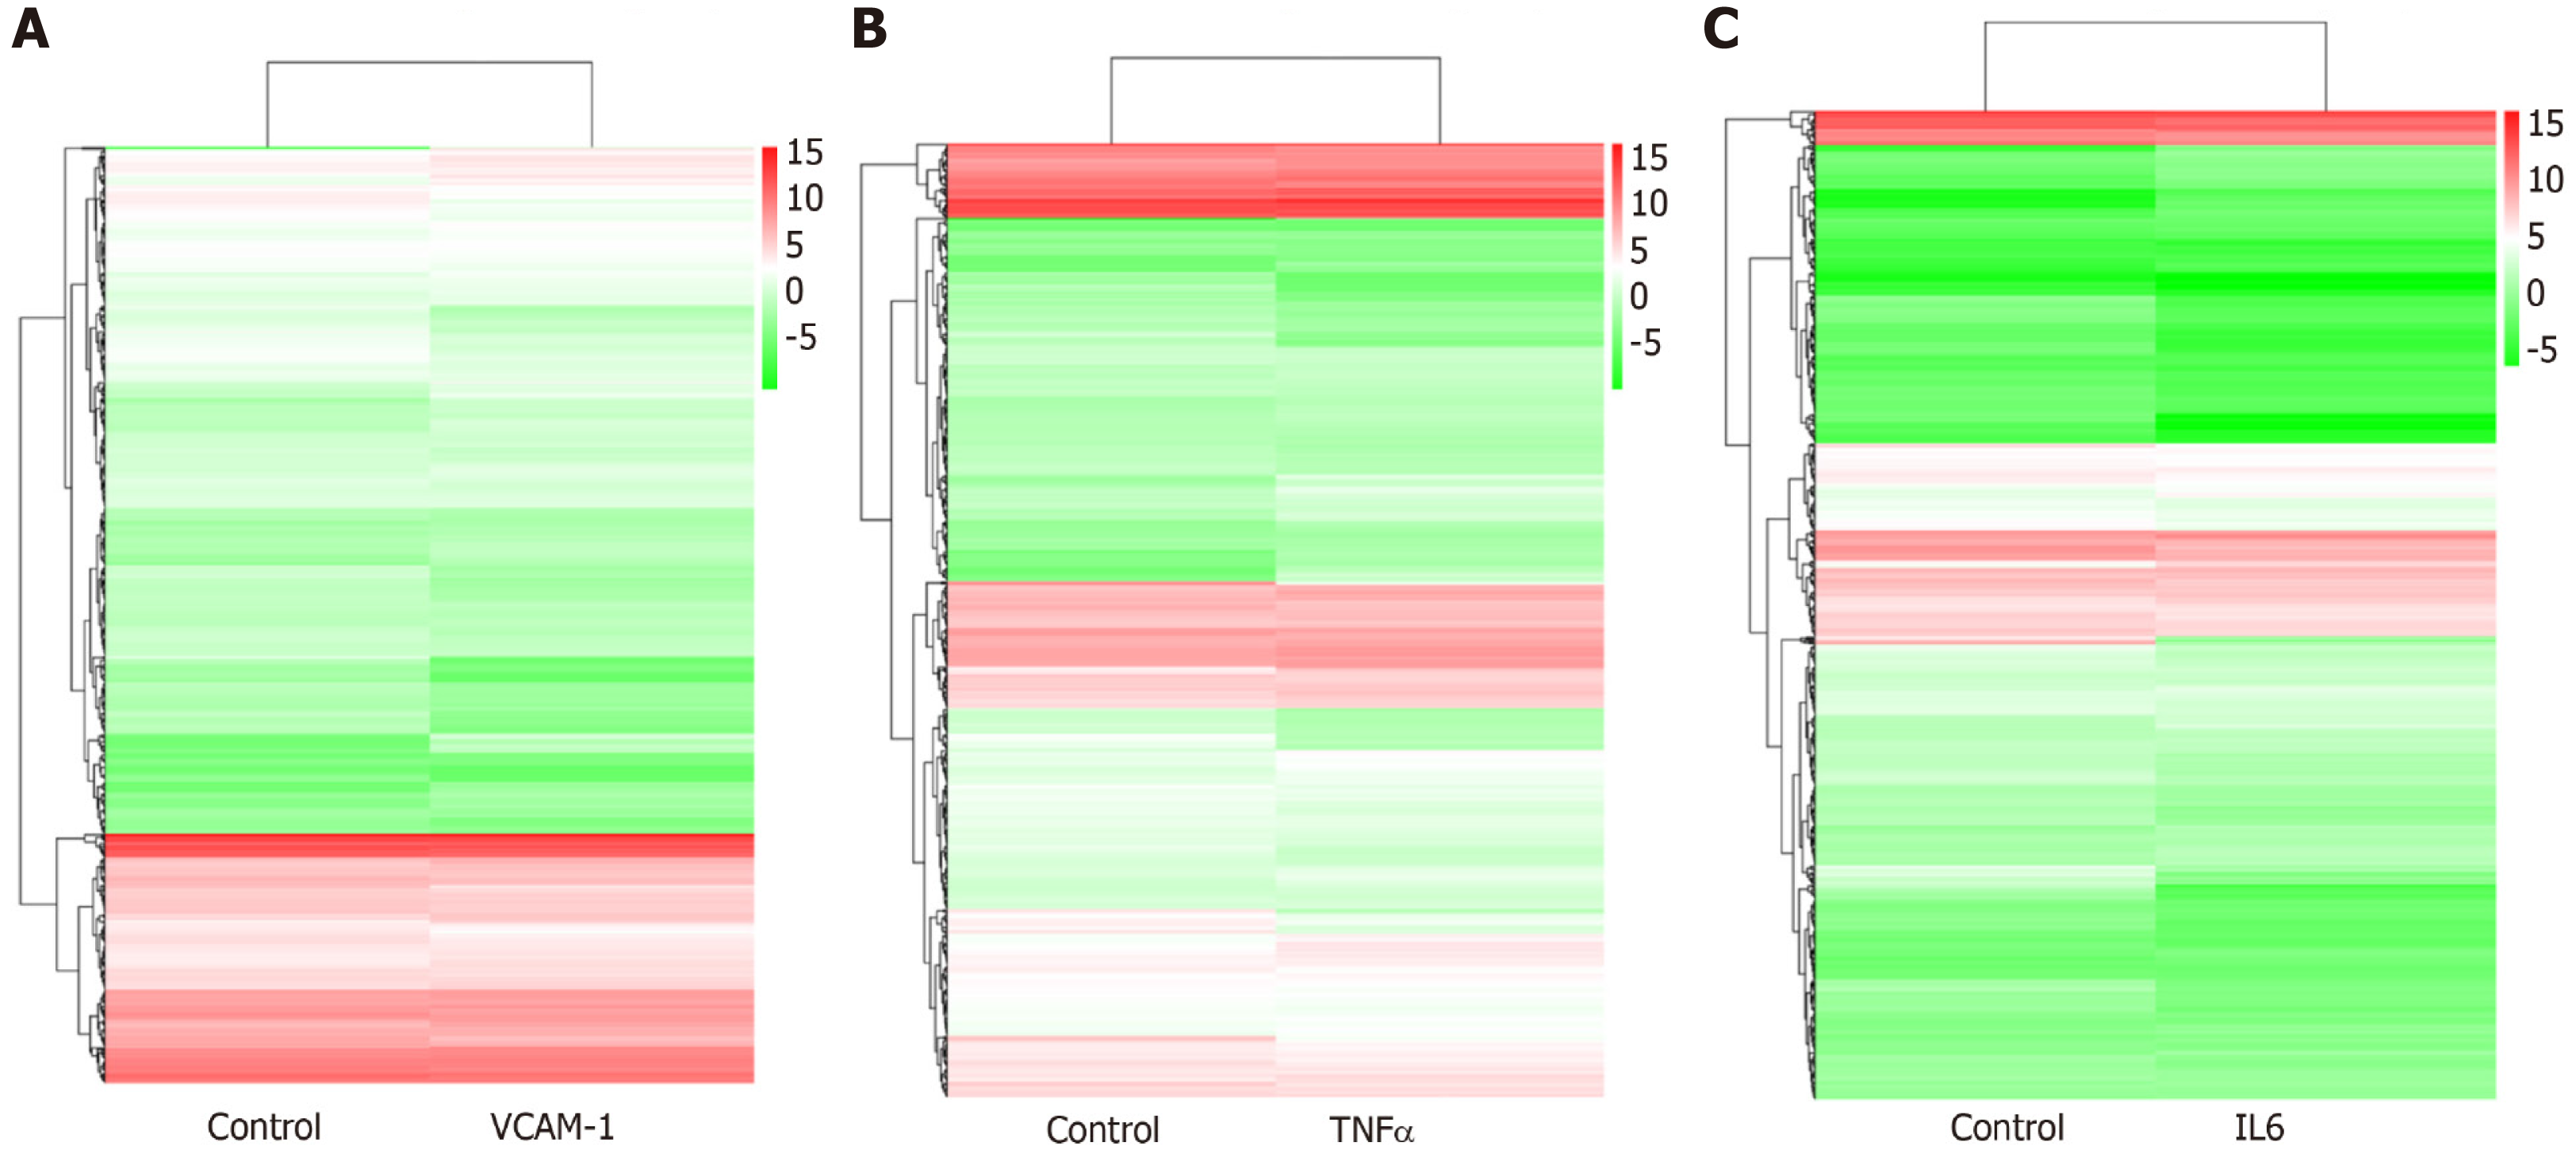
Figure 7 Hierarchical clustering of differentially expressed miRNAs.
A: Vascular cell adhesion molecule-1 group vs control group; B: Tumor necrosis factor α group vs control group; C: Interleukin 6 group vs control group. The X axis represents each pair of differences, and the Y axis represents differentially expressed miRNAs. The colors indicate the fold change, with red showing up-regulation, and blue showing down-regulation. TNF: Tumor necrosis factor; IL6: Interleukin 6.
- Citation: Huang C, Luo WF, Ye YF, Lin L, Wang Z, Luo MH, Song QD, He XP, Chen HW, Kong Y, Tang YK. Characterization of inflammatory factor-induced changes in mesenchymal stem cell exosomes and sequencing analysis of exosomal microRNAs. World J Stem Cells 2019; 11(10): 859-890
- URL: https://www.wjgnet.com/1948-0210/full/v11/i10/859.htm
- DOI: https://dx.doi.org/10.4252/wjsc.v11.i10.859


